Star Date 20 February 2017 President's Day Monday
Captain's Log
Happy President's Day.
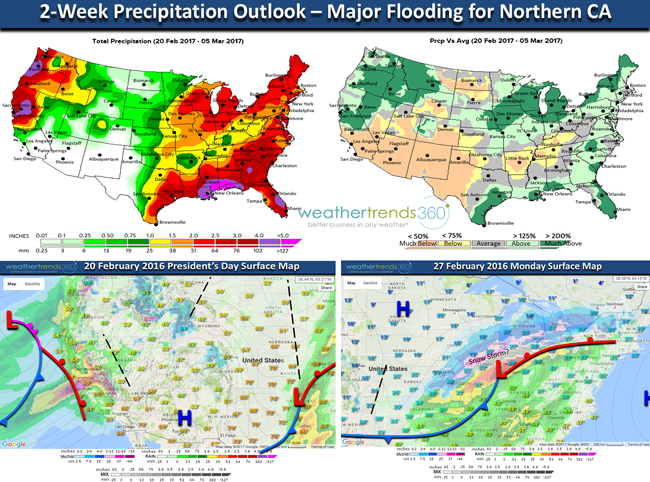
California is clearly on pace to break their wettest water season on record (1983) with a non-stop series of storms. With Sierra snowpack also well above average the Spring snow melt season through May is going to pose a lot of problems. There was $2 billion in flooding damages back in 1983, this year could be worse. Another 5"+ for Northern California, right were Oroville Dam is located. CLICK ON ANY IMAGE FOR FULL VIEW
The West Coast storm track is in large part due to a very sharp gradient between cold North Pacific Ocean temperatures and a warm Central Pacific allowing for an intense Jet Stream to set up between the two and plowing right into California. Large High Pressure off the warm Atlantic ocean has kept the Southeast very warm and sending the Jet Stream into the Great Lakes and New England allowing the warmth to surge up the East Coast in advance of these storms. This has also kept the weather pattern transient, not allowing any cold snaps to last very long. This appears it could be changing based on some cycles and models.
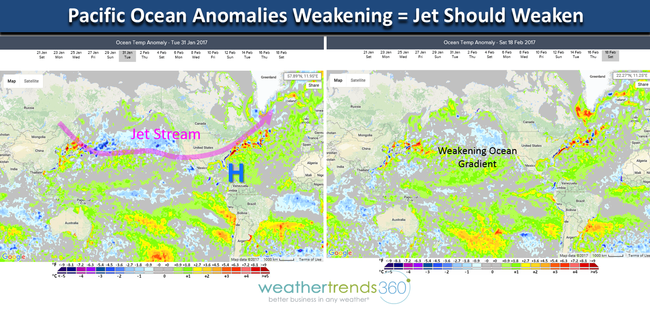
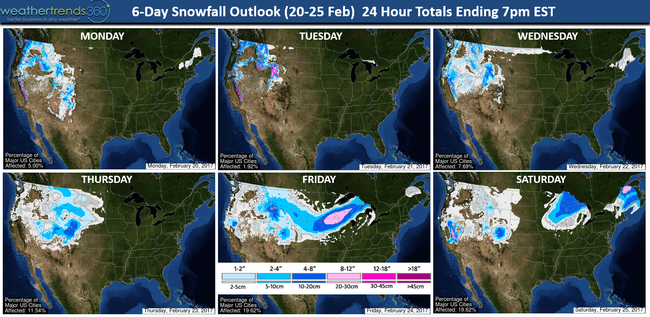
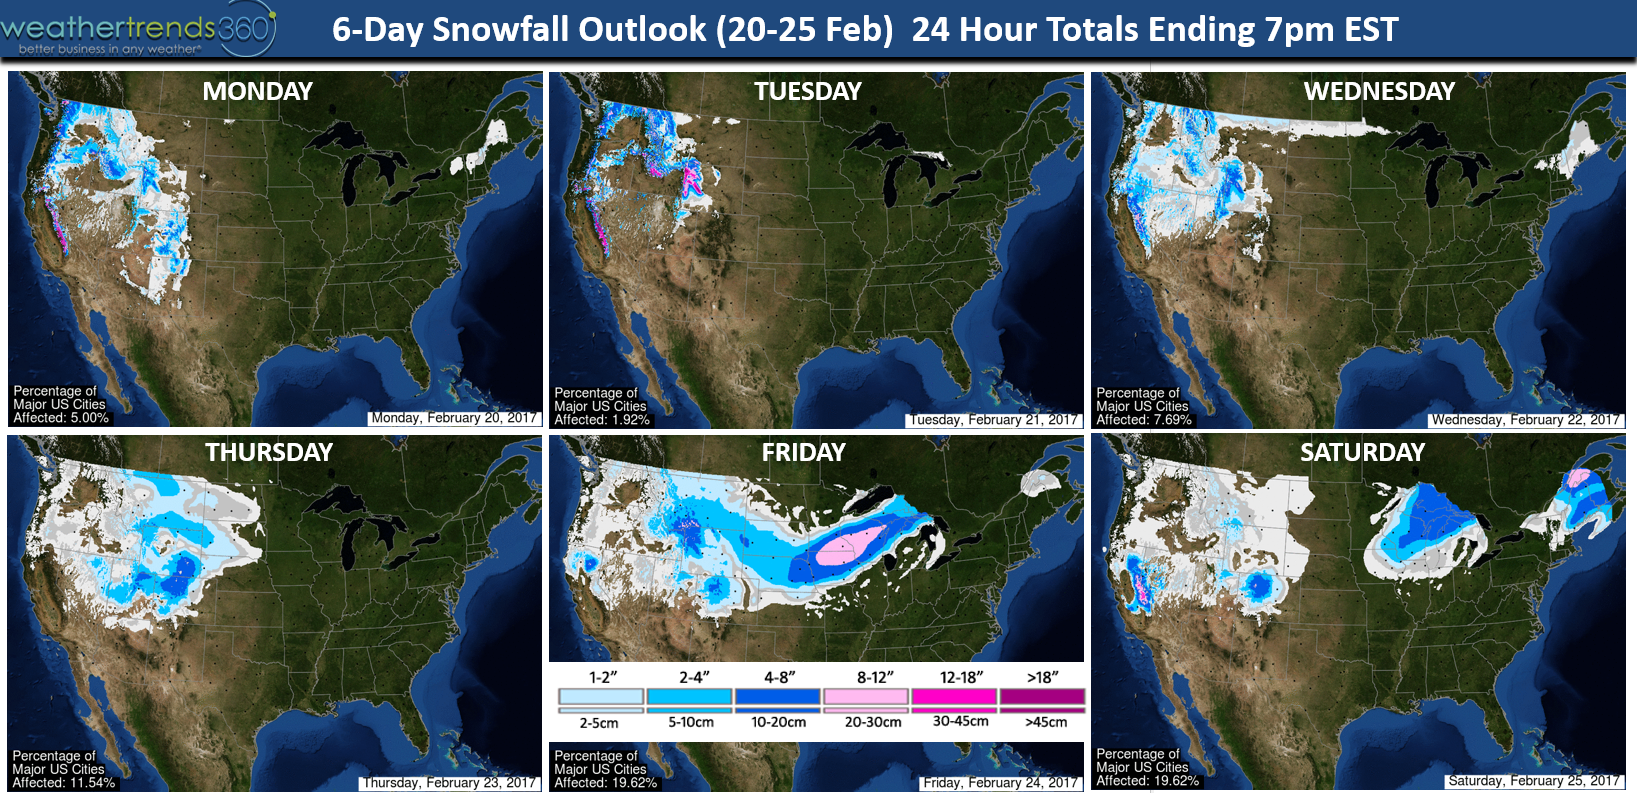
That track will continue over the next week but an MJO cycle, weakening Pacific Ocean temperature gradient and massive Arctic air building in Canada suggest a pattern change is taking shape for North America. As an example, the current storm track for these early week systems brings heavy snow from Colorado to Wisconsin with Spring-like weather out in front of it, but next weekend the track is further South with snow more likely from Colorado to Missouri into Chicago and interior Northeast (see maps below).
The European model is much more excited about a colder Eastern half of the U.S. than the U.S. GFS model as we transition into March. The Euro usually picks up on pattern changes quicker than the GFS so time will tell but don't expect these blow torch warm temps to continue.
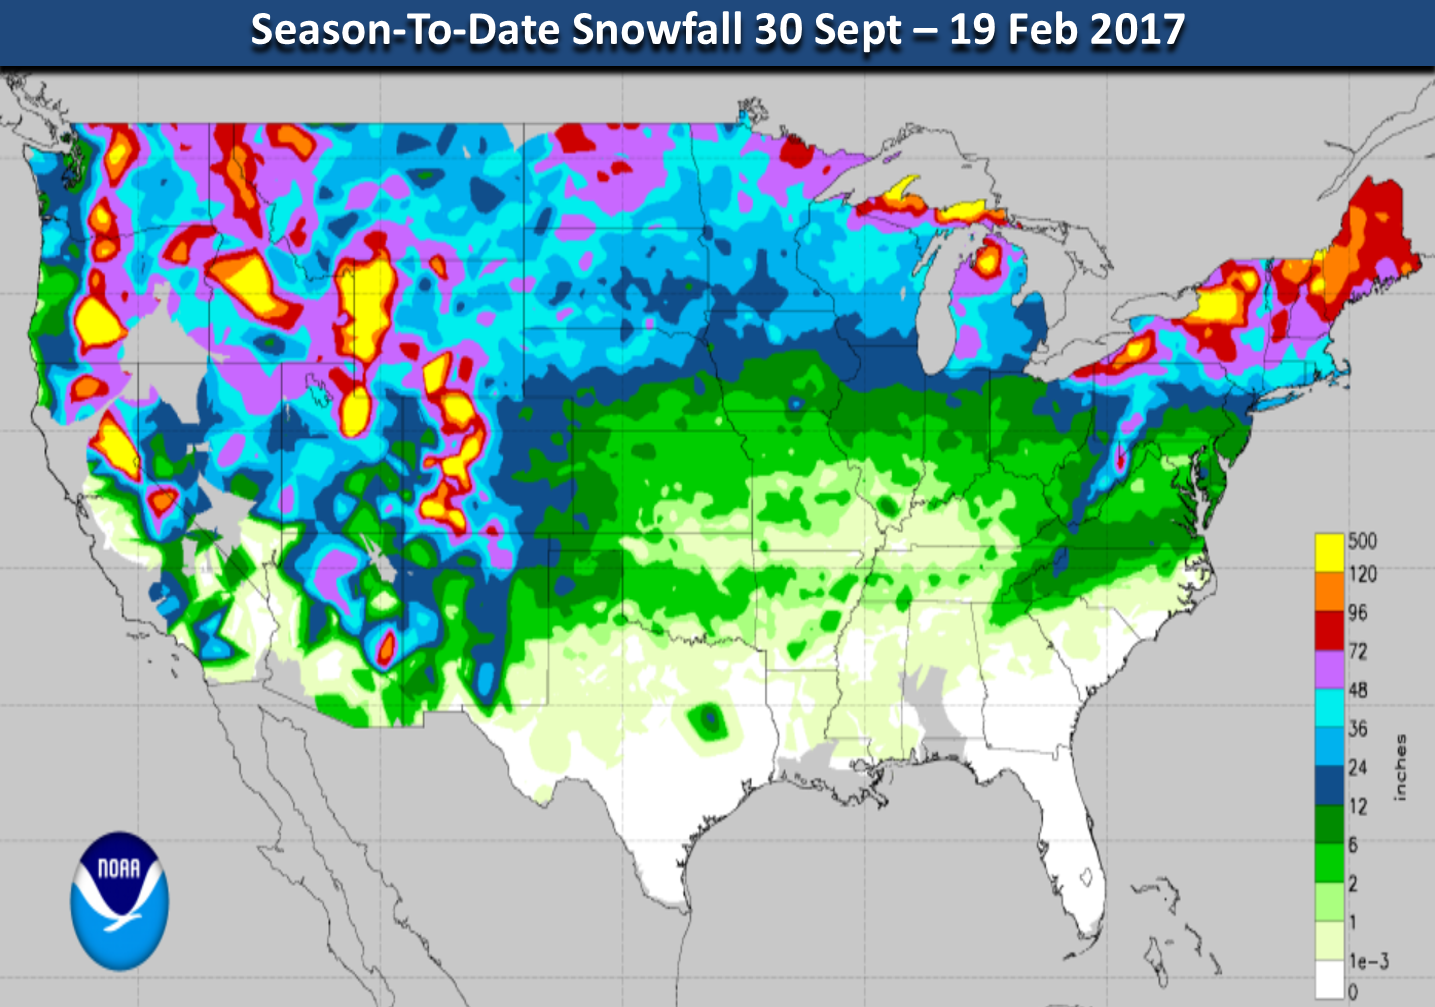
This persistent storm track has brought heavy snowfall from the West into the Upper Plains and New England with pretty tight snow gradients over short distances. New York and Pennsylvania as an example: only 8" in Philadelphia (below average snowfall), 23" in New York City(slightly above average snow to date) and 103" in Syracuse New York (above average snow to date).

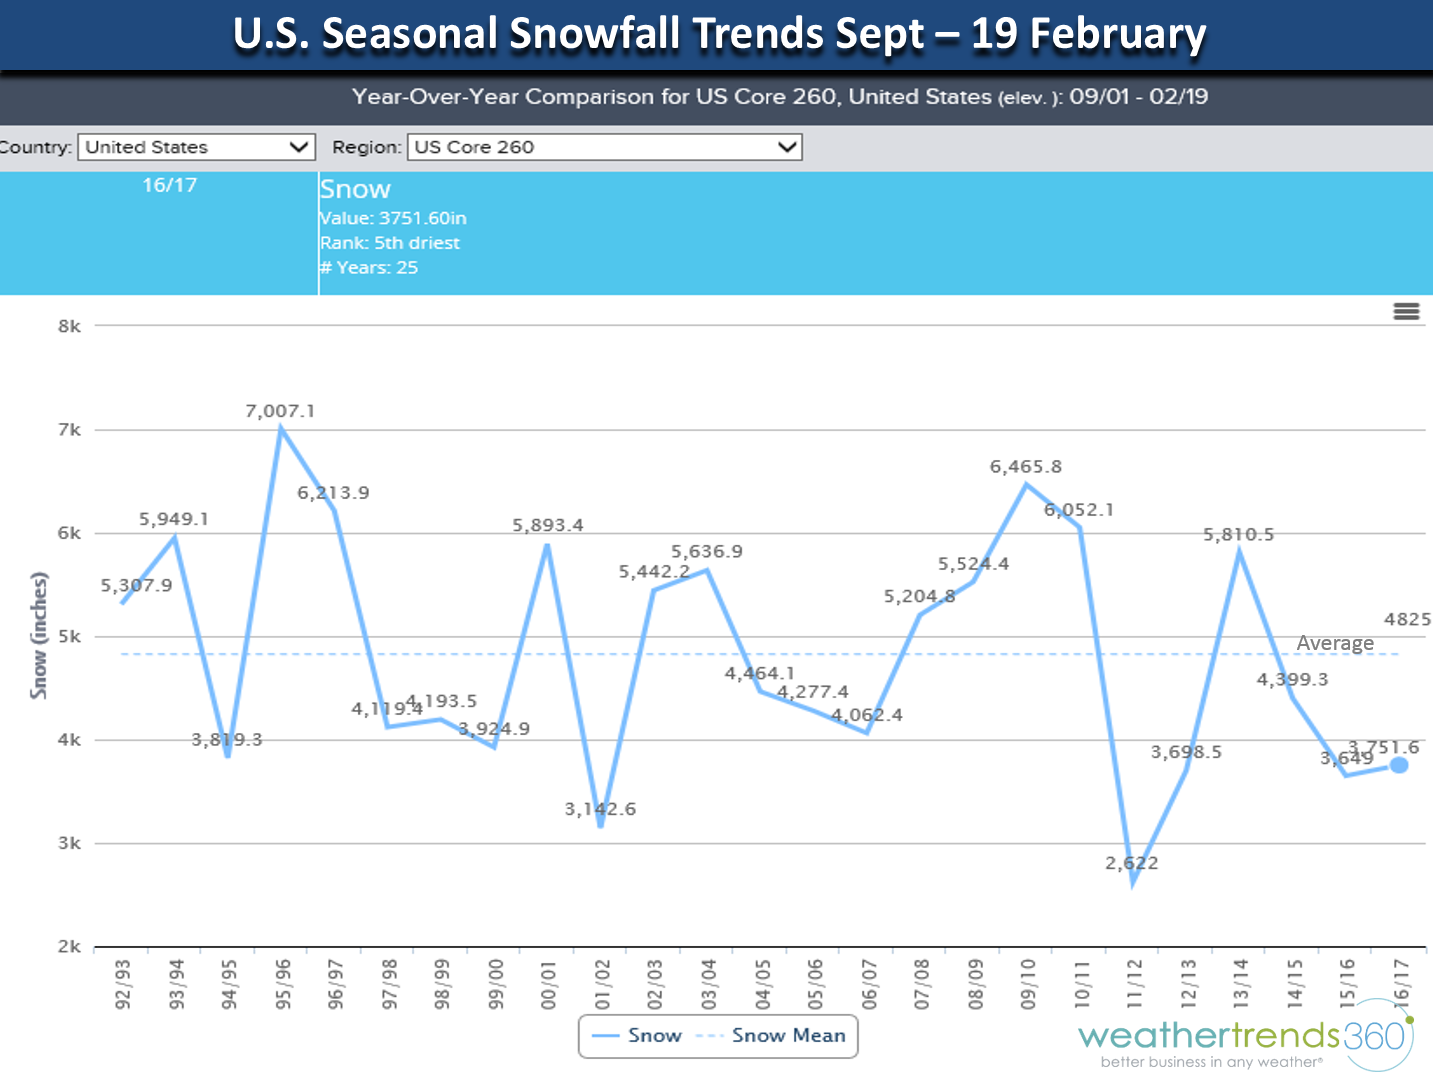
For the U.S. overall snowfall across 260 major cities is trending below average for the 1 Sept to 20 Feb season to date.

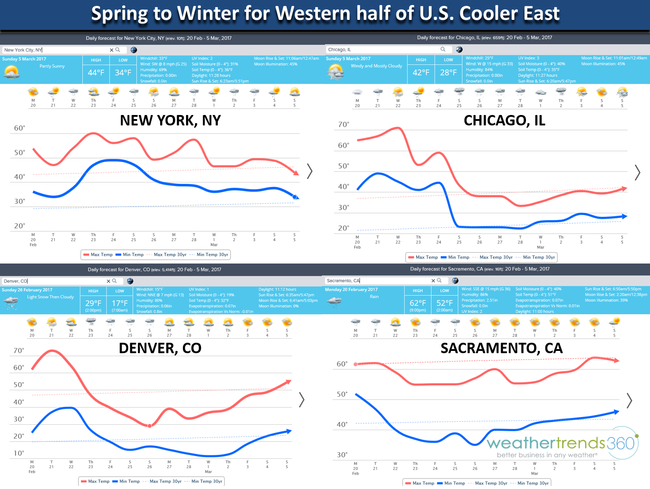
But the pattern change is evident this week with temperatures plummeting 3o to 40 degrees in the Central U.S. and more seasonable in the Northeast week 2 after a big warm Spring surge. Charts below show the transition from New York City to Sacramento with the cold impacting the West first then the Central U.S. and eventually the Northeast. The Southeast is likely to escape the cold for now. Vegetation is already sprouting about 3-4 weeks early in the Southeast so this does pose a problem if a March cold snap does happen mid month in the Southeast.
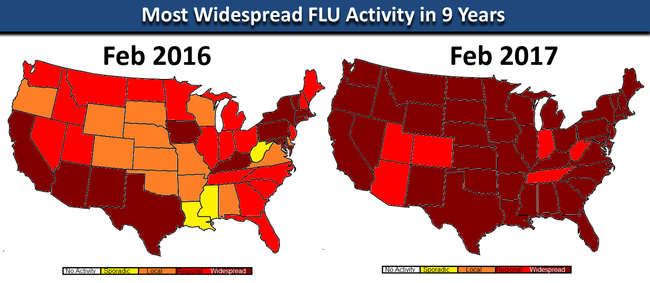
With the early onset of very cold weather back in December, the Flu season got off to an earlier start than last year and now has the entire U.S. gripped in widespread flu. This is the most widespread nationwide outbreak in 9 years! If you're healthy...can't your blessings as there are a lot of sick folks out there. :( Hope you feel better.
Finally, this past weekend here in the Lehigh Valley of Pennsylvania we watched our snow disappear with a Spring-like weekend. Baby Angelina Kirk enjoyed it testing out her new car. :) This won't be the last snow of the season as March will certainly bring at least 1 maybe 2 snow storms to the snow deprived southern regions of the Northeast.

Have a great week folks! - Capt Kirk out.
California is clearly on pace to break their wettest water season on record (1983) with a non-stop series of storms. With Sierra snowpack also well above average the Spring snow melt season through May is going to pose a lot of problems. There was $2 billion in flooding damages back in 1983, this year could be worse. Another 5"+ for Northern California, right were Oroville Dam is located. CLICK ON ANY IMAGE FOR FULL VIEW
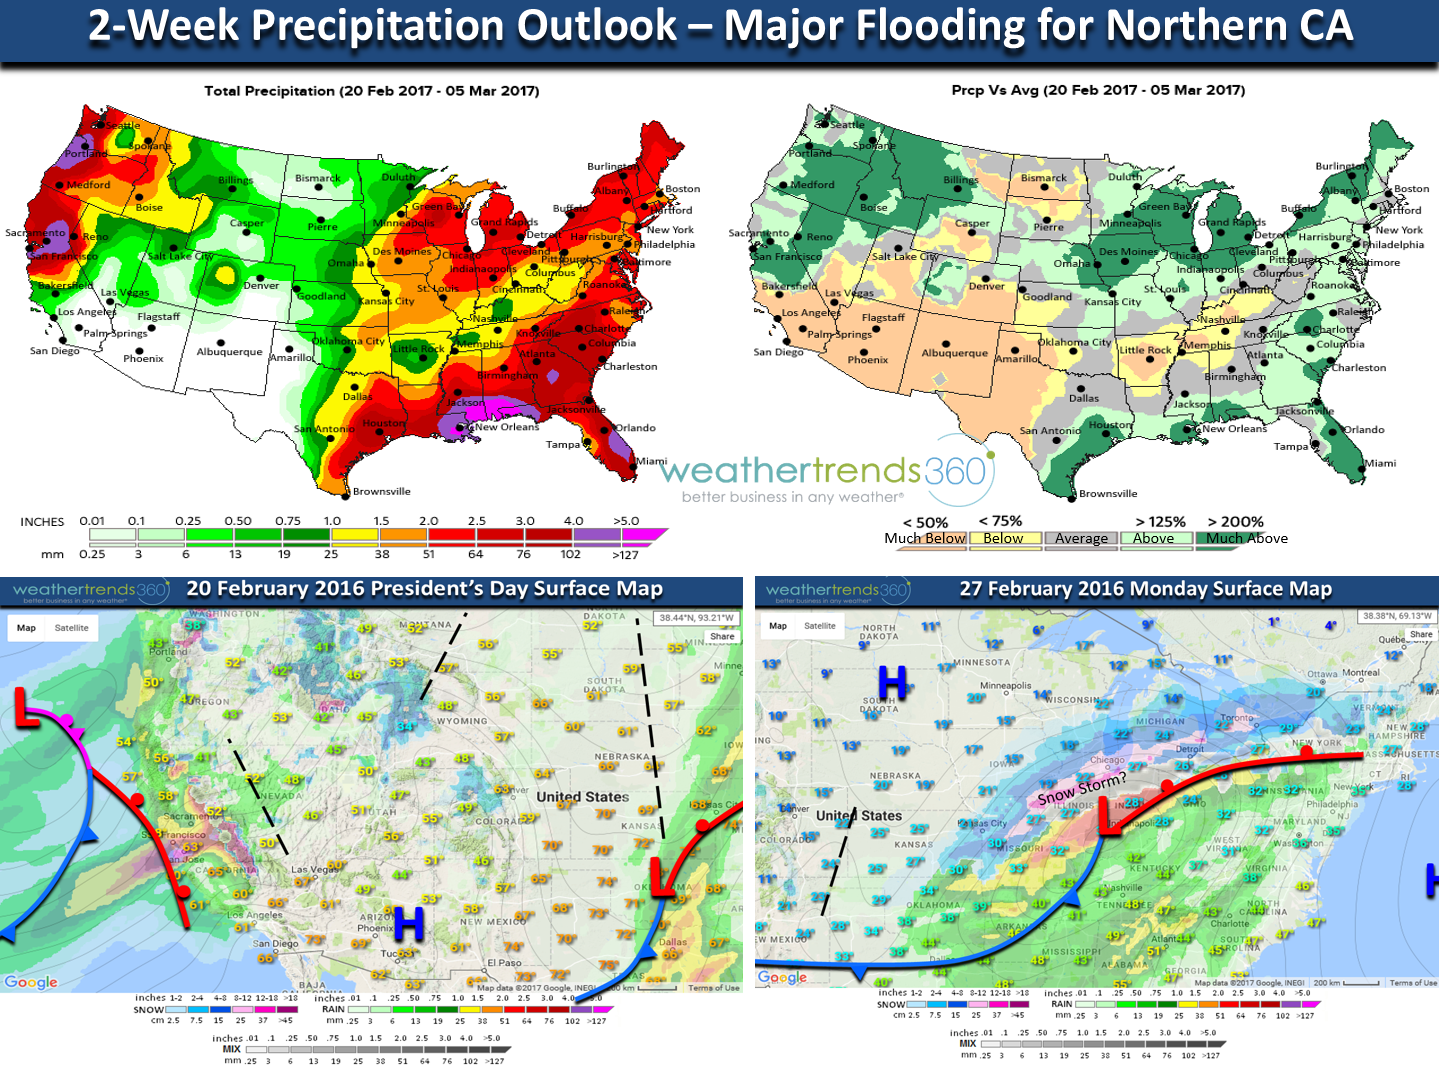
The West Coast storm track is in large part due to a very sharp gradient between cold North Pacific Ocean temperatures and a warm Central Pacific allowing for an intense Jet Stream to set up between the two and plowing right into California. Large High Pressure off the warm Atlantic ocean has kept the Southeast very warm and sending the Jet Stream into the Great Lakes and New England allowing the warmth to surge up the East Coast in advance of these storms. This has also kept the weather pattern transient, not allowing any cold snaps to last very long. This appears it could be changing based on some cycles and models.
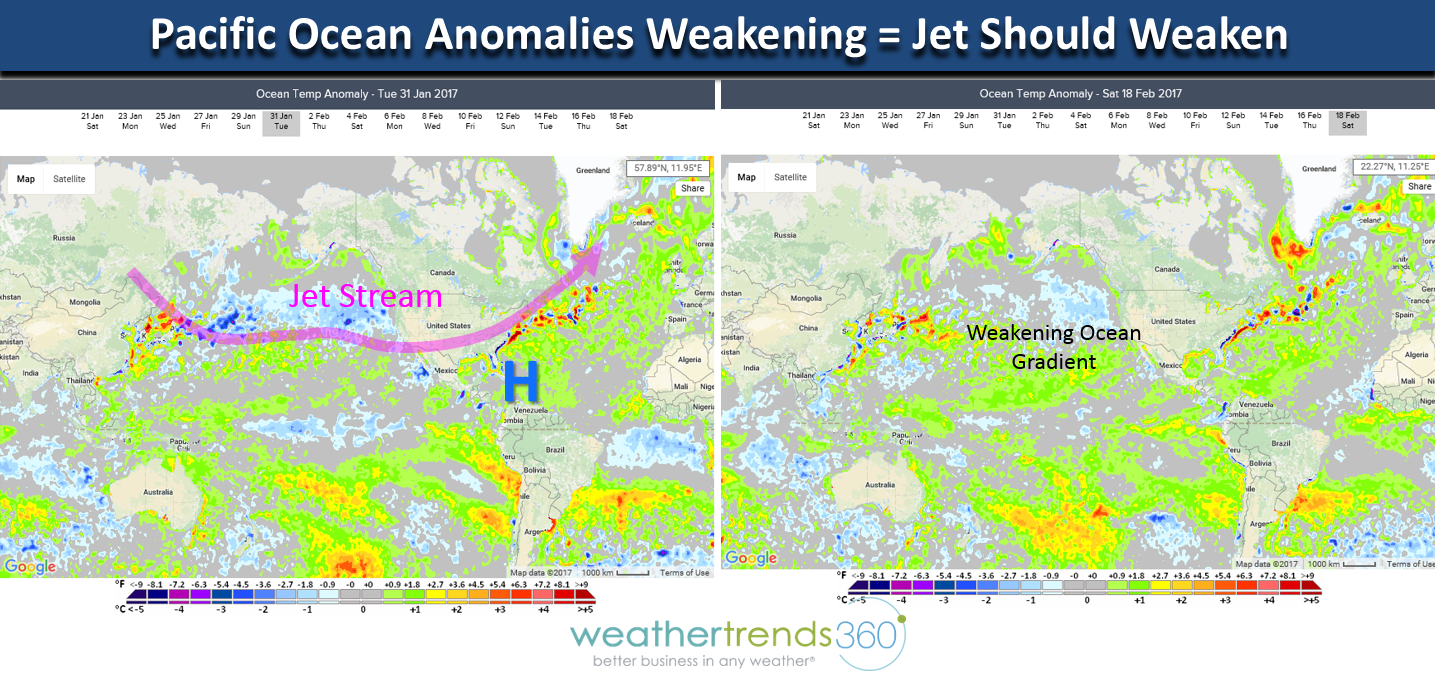
That track will continue over the next week but an MJO cycle, weakening Pacific Ocean temperature gradient and massive Arctic air building in Canada suggest a pattern change is taking shape for North America. As an example, the current storm track for these early week systems brings heavy snow from Colorado to Wisconsin with Spring-like weather out in front of it, but next weekend the track is further South with snow more likely from Colorado to Missouri into Chicago and interior Northeast (see maps below).
The European model is much more excited about a colder Eastern half of the U.S. than the U.S. GFS model as we transition into March. The Euro usually picks up on pattern changes quicker than the GFS so time will tell but don't expect these blow torch warm temps to continue.
This persistent storm track has brought heavy snowfall from the West into the Upper Plains and New England with pretty tight snow gradients over short distances. New York and Pennsylvania as an example: only 8" in Philadelphia (below average snowfall), 23" in New York City(slightly above average snow to date) and 103" in Syracuse New York (above average snow to date).
For the U.S. overall snowfall across 260 major cities is trending below average for the 1 Sept to 20 Feb season to date.
But the pattern change is evident this week with temperatures plummeting 3o to 40 degrees in the Central U.S. and more seasonable in the Northeast week 2 after a big warm Spring surge. Charts below show the transition from New York City to Sacramento with the cold impacting the West first then the Central U.S. and eventually the Northeast. The Southeast is likely to escape the cold for now. Vegetation is already sprouting about 3-4 weeks early in the Southeast so this does pose a problem if a March cold snap does happen mid month in the Southeast.

With the early onset of very cold weather back in December, the Flu season got off to an earlier start than last year and now has the entire U.S. gripped in widespread flu. This is the most widespread nationwide outbreak in 9 years! If you're healthy...can't your blessings as there are a lot of sick folks out there. :( Hope you feel better.

Finally, this past weekend here in the Lehigh Valley of Pennsylvania we watched our snow disappear with a Spring-like weekend. Baby Angelina Kirk enjoyed it testing out her new car. :) This won't be the last snow of the season as March will certainly bring at least 1 maybe 2 snow storms to the snow deprived southern regions of the Northeast.

Have a great week folks! - Capt Kirk out.