Star Date 28 October 2016 Friday
Captain's Log
October 2016 is just about in the history books so let's take a look at some of the more interesting weather trends around the globe.
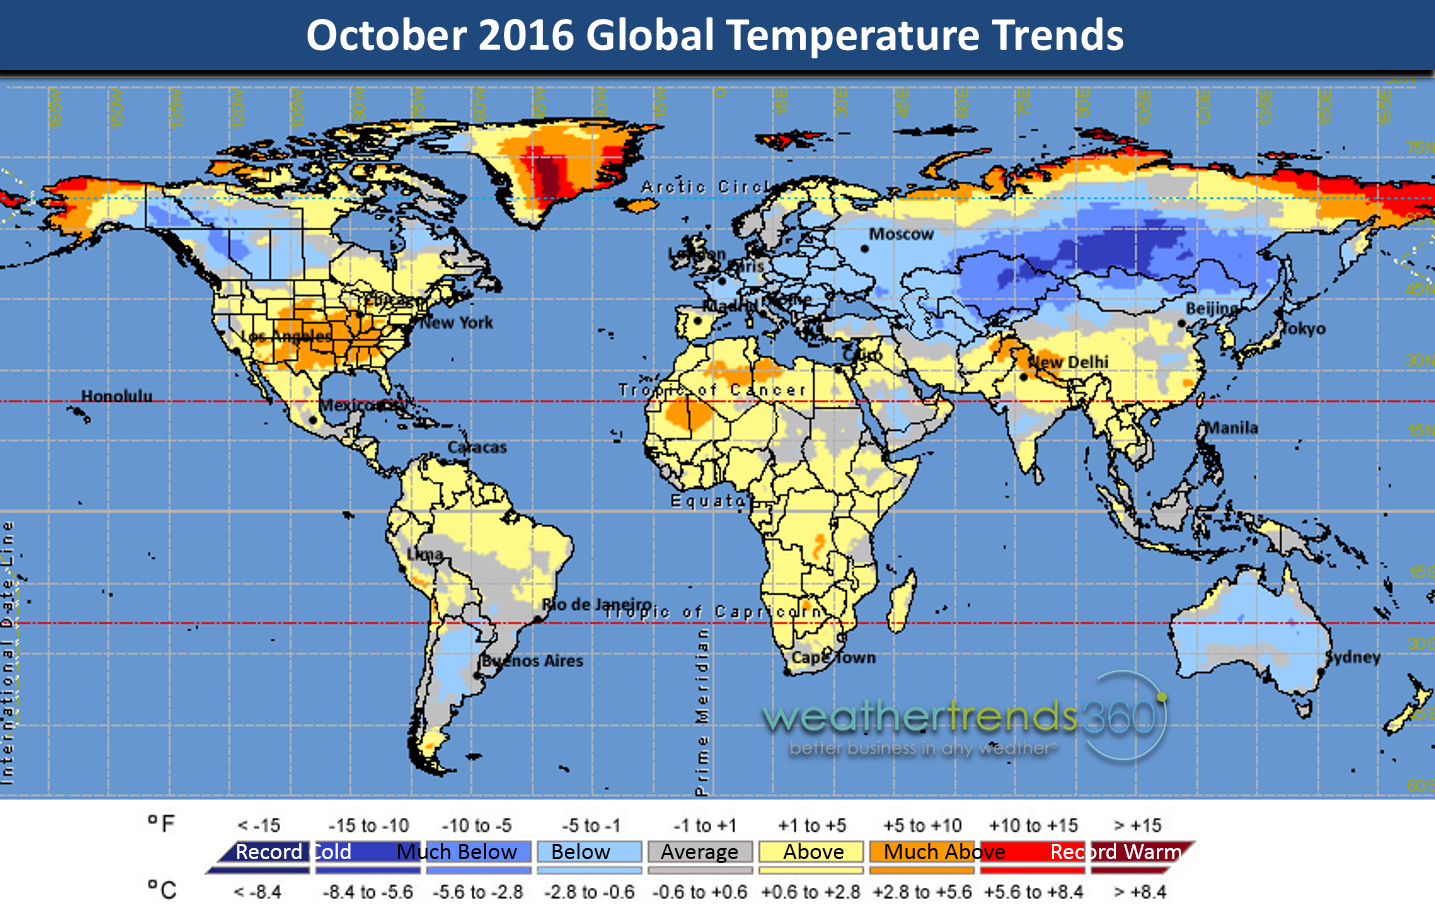
TEMPERATURES: While the U.S. has clearly had a very warm, possibly record warm October with only short-lived bursts of colder weather, that's not been the case in many other areas around the globe. Central Russia/Siberia has clearly been the cold spot with the coldest conditions in over 25 years (cities like Bratsk, Chita, Krasnoyarsk). Russia overall is the 3rd coldest October in 25+ years. Northeast China has also been the coldest in 25+ years with China overall the coldest in 5 years. Mongolia has been very cold trending 3rd coldest of the past 25 years and coldest in 14 years. Europe overall is the coldest in 13 years as is Australia in the Southern Hemisphere. Canada has been the coldest in 4 years and 4th coldest of the past 25 years - especially in the West. The global population weather index shows October the coldest in 7 years (since 2009) for the thousands of cities around the world. Cold October weather trends in Siberia, along with snow cover are frequently a moderately strong indicator of a pending cold Winter for much of the Northern Hemisphere and frequently the U.S. (CLICK ON IMAGES FOR LARGER VIEW)
 CURRENT LOW TEMPS TODAY: We can start to see temperatures really plummeting in Siberia with conditions well below average. A lot of snow on the ground there so the Arctic air will continue to build in this source region. Plus we're losing several minutes of daylight everyday so the shorter days make it get colder and colder providing there's snow on the ground.
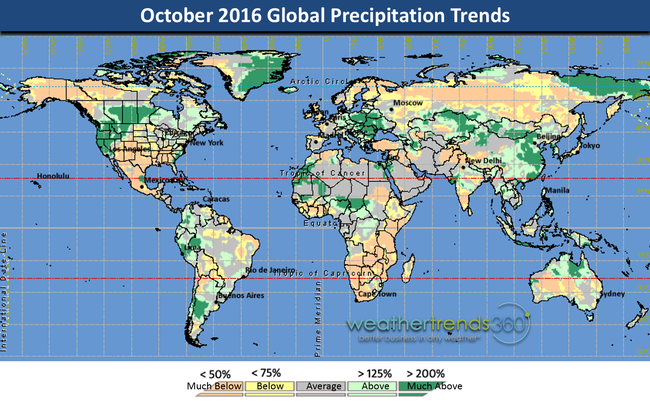
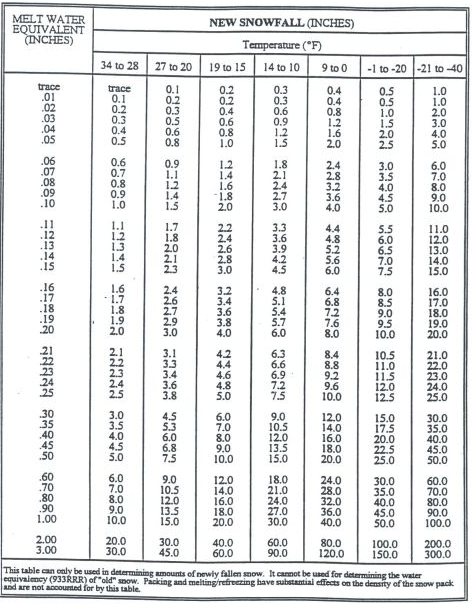
PRECIPITATION: While Siberia has been drier than normal (common with cold weather) it doesn't take much precipitation to make a lot of snow with super cold weather. Remember thesimple rules of thumb - one inch of rain is about 10" of snow at 32F but every degree colder means another 1.5" of snow. So that same 1" of "rain" (liquid equivalent) will create 20" of snow at 17F degrees but 40" at 4F and a whopping 100" at -30F. See table below.
The snow across Siberia has piled up with a lot of the area much above average snowfall. This is important as it allows Arctic cold air to build early in advance of the Winter season making severe cold outbreaks more likely in many areas of the Northern Hemisphere and U.S. Early snow pack frequently means early onset of cold weather in the U.S. in December and that is our forecast - cold December in the Eastern half of the U.S.
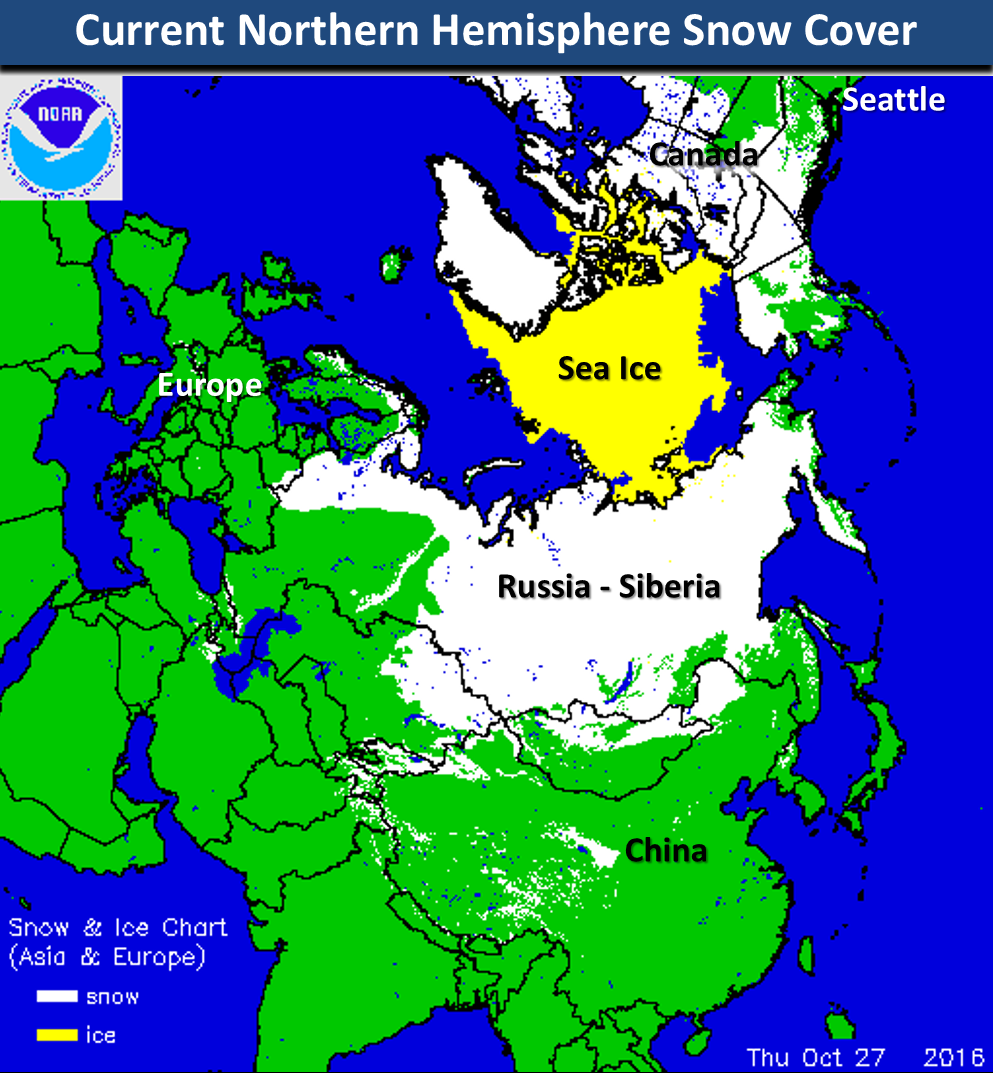
NORTHERN HEMISPHERE SNOW COVER: Widespread snow cover is off to an early start across Western Canada and Siberia.
GLOBAL WEATHER TRENDS: The charts below show the global temperature index based on thousands of weather reporting stations around the world - where people live, not the oceans. Overall the coolest and wettest in 7 years going back to 2009. I'm sure Winter cold and snow lovers remember the 2009-2010 winter well in the U.S. as it was one of the coldest/snowiest in decades! Yes there is risk for that again this Winter, maybe not quite as extreme as that year.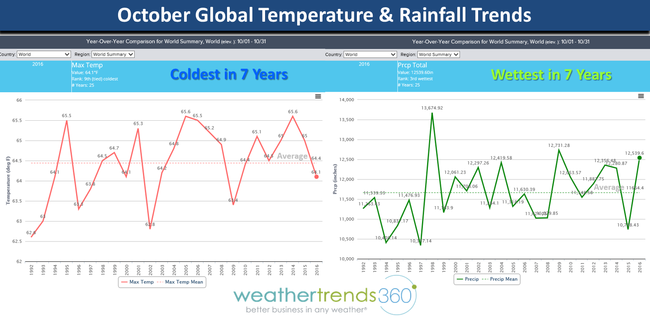
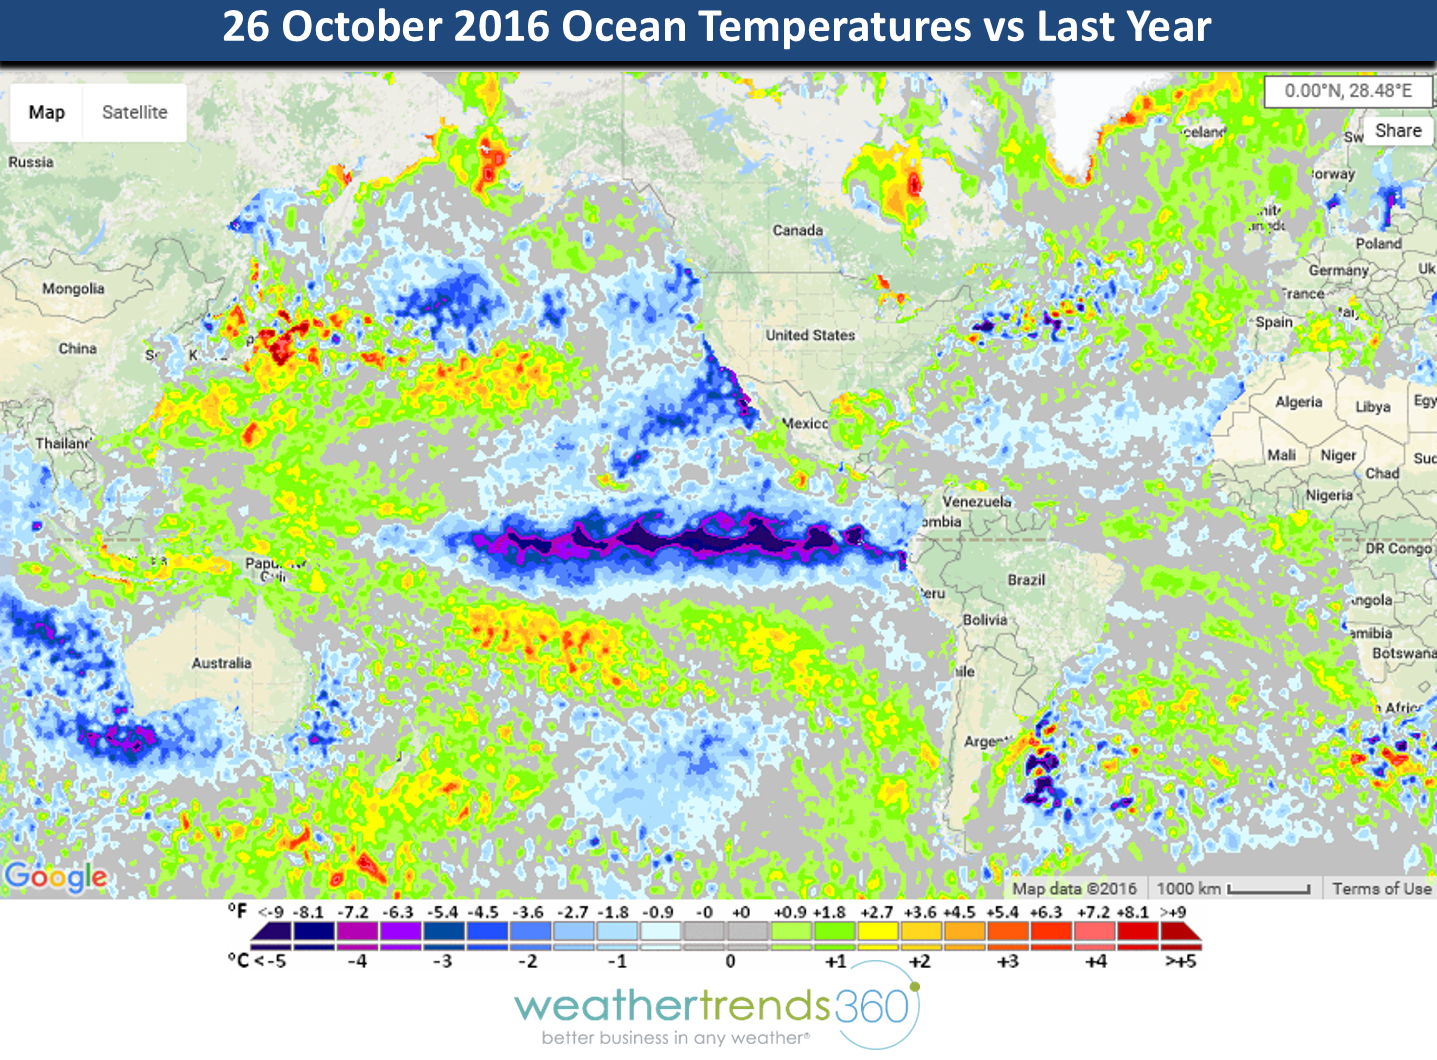
OCEAN WATER TEMPERATURE TRENDS: There is absolutely NOTHING similar in the Ocean climate cycles when compared to this time last year. Last year we had a mega El Nino emerging, this year polar opposite with a weak Central Pacific based La Nina type weather pattern. Weak Central based La Nina's are very frequently cold and snowy in the Eastern half of the U.S. and especially the Upper Midwest, Great Lakes and Northeast with frequent Albert Clipper type systems.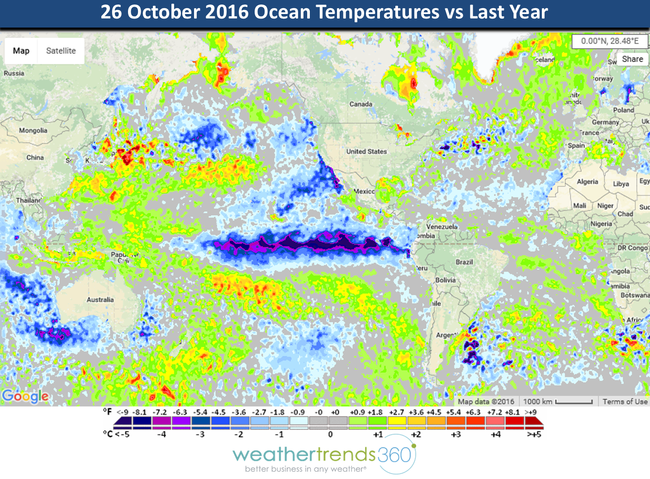
So, we have a very interesting Winter 2016-2017 in store! We generally think the major pattern shift in the U.S. will happen around Thanksgiving and especially December.
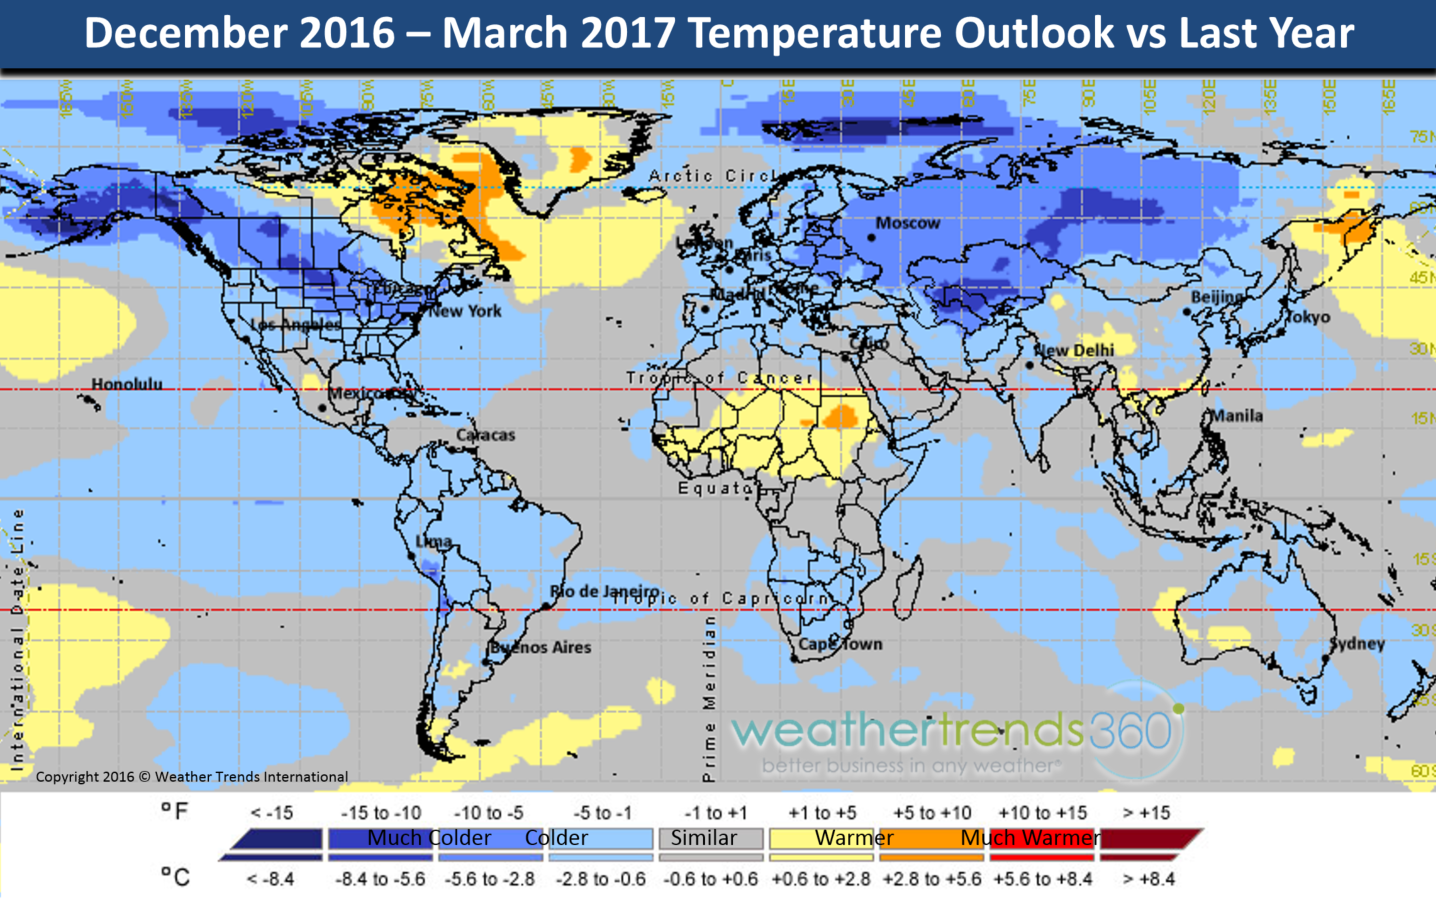
Yes we think many will have a white Christmas this year! :) Kids are saying HORRAY! Love to tell you more about what we see all the way into Fall 2017 next year but that's what clients pay for (see our free and paid plans page). Below is a hint showing the December 2016 - March 2017 temperature trends vs a year ago; in theory as the oceans cool so does the planet. Week-by-week year-ahead trends for 21 million locations worldwide for temps, rain and snow compared to last year, 30-year averages, etc. are available to clients.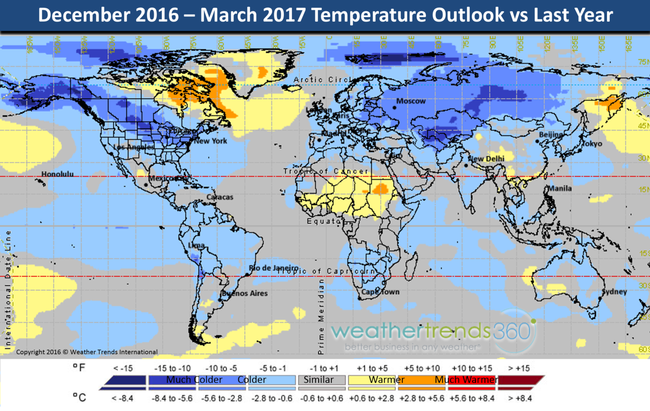
Follow us on Facebook and Twitter for daily updates.
Have a great weekend. - Capt Kirk out (USAF 1989-1999)
TEMPERATURES: While the U.S. has clearly had a very warm, possibly record warm October with only short-lived bursts of colder weather, that's not been the case in many other areas around the globe. Central Russia/Siberia has clearly been the cold spot with the coldest conditions in over 25 years (cities like Bratsk, Chita, Krasnoyarsk). Russia overall is the 3rd coldest October in 25+ years. Northeast China has also been the coldest in 25+ years with China overall the coldest in 5 years. Mongolia has been very cold trending 3rd coldest of the past 25 years and coldest in 14 years. Europe overall is the coldest in 13 years as is Australia in the Southern Hemisphere. Canada has been the coldest in 4 years and 4th coldest of the past 25 years - especially in the West. The global population weather index shows October the coldest in 7 years (since 2009) for the thousands of cities around the world. Cold October weather trends in Siberia, along with snow cover are frequently a moderately strong indicator of a pending cold Winter for much of the Northern Hemisphere and frequently the U.S. (CLICK ON IMAGES FOR LARGER VIEW)
 CURRENT LOW TEMPS TODAY: We can start to see temperatures really plummeting in Siberia with conditions well below average. A lot of snow on the ground there so the Arctic air will continue to build in this source region. Plus we're losing several minutes of daylight everyday so the shorter days make it get colder and colder providing there's snow on the ground.
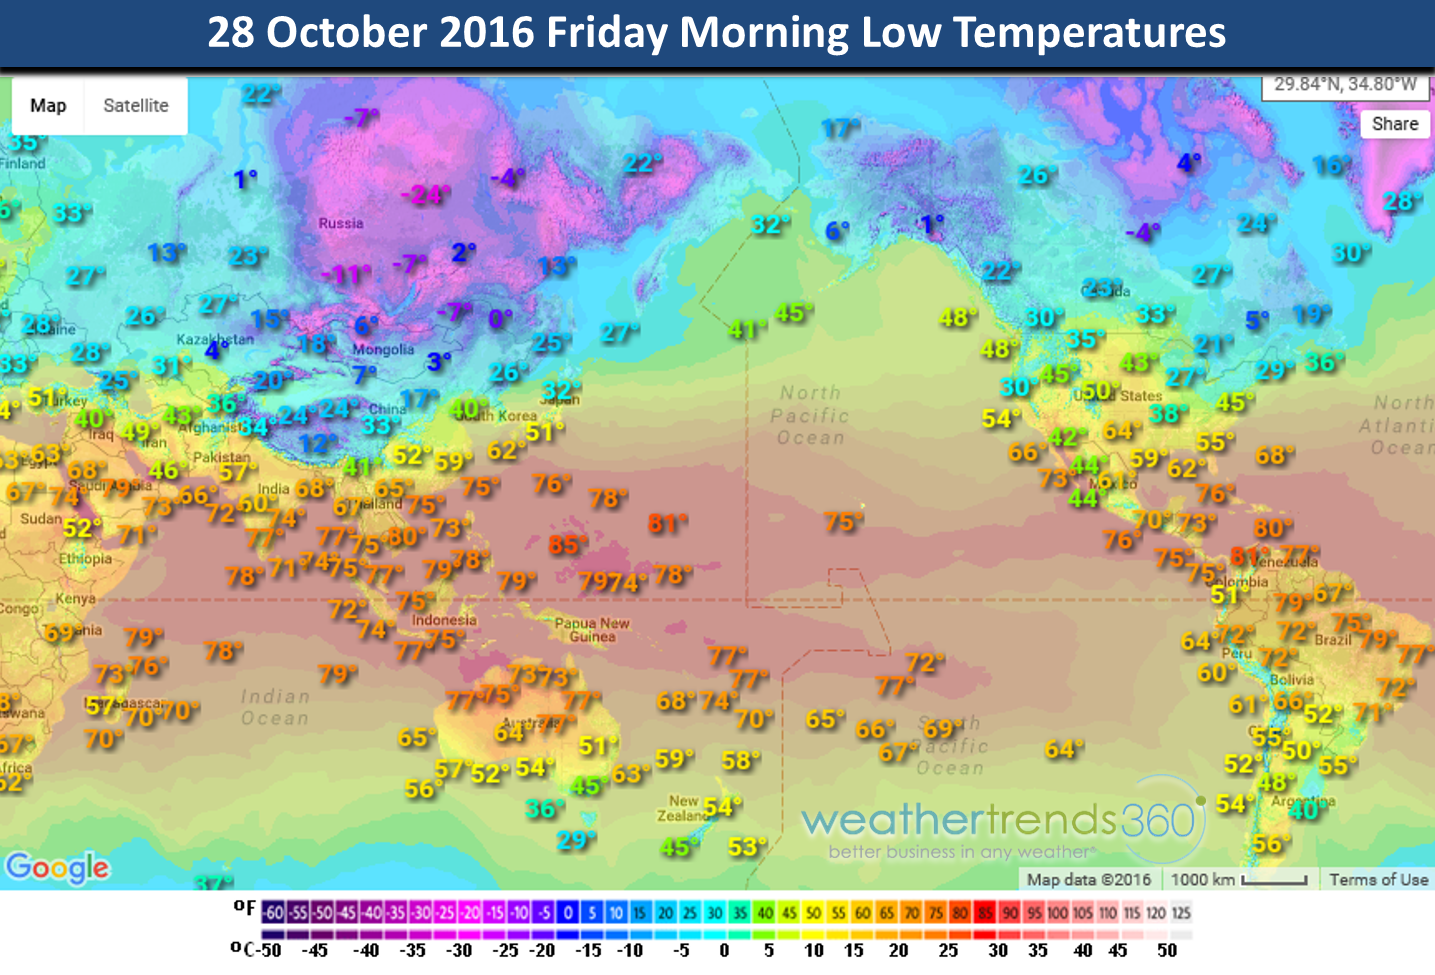
PRECIPITATION: While Siberia has been drier than normal (common with cold weather) it doesn't take much precipitation to make a lot of snow with super cold weather. Remember thesimple rules of thumb - one inch of rain is about 10" of snow at 32F but every degree colder means another 1.5" of snow. So that same 1" of "rain" (liquid equivalent) will create 20" of snow at 17F degrees but 40" at 4F and a whopping 100" at -30F. See table below.
The snow across Siberia has piled up with a lot of the area much above average snowfall. This is important as it allows Arctic cold air to build early in advance of the Winter season making severe cold outbreaks more likely in many areas of the Northern Hemisphere and U.S. Early snow pack frequently means early onset of cold weather in the U.S. in December and that is our forecast - cold December in the Eastern half of the U.S.

NORTHERN HEMISPHERE SNOW COVER: Widespread snow cover is off to an early start across Western Canada and Siberia.
GLOBAL WEATHER TRENDS: The charts below show the global temperature index based on thousands of weather reporting stations around the world - where people live, not the oceans. Overall the coolest and wettest in 7 years going back to 2009. I'm sure Winter cold and snow lovers remember the 2009-2010 winter well in the U.S. as it was one of the coldest/snowiest in decades! Yes there is risk for that again this Winter, maybe not quite as extreme as that year.

OCEAN WATER TEMPERATURE TRENDS: There is absolutely NOTHING similar in the Ocean climate cycles when compared to this time last year. Last year we had a mega El Nino emerging, this year polar opposite with a weak Central Pacific based La Nina type weather pattern. Weak Central based La Nina's are very frequently cold and snowy in the Eastern half of the U.S. and especially the Upper Midwest, Great Lakes and Northeast with frequent Albert Clipper type systems.
So, we have a very interesting Winter 2016-2017 in store! We generally think the major pattern shift in the U.S. will happen around Thanksgiving and especially December.
Yes we think many will have a white Christmas this year! :) Kids are saying HORRAY! Love to tell you more about what we see all the way into Fall 2017 next year but that's what clients pay for (see our free and paid plans page). Below is a hint showing the December 2016 - March 2017 temperature trends vs a year ago; in theory as the oceans cool so does the planet. Week-by-week year-ahead trends for 21 million locations worldwide for temps, rain and snow compared to last year, 30-year averages, etc. are available to clients.
Follow us on Facebook and Twitter for daily updates.
Have a great weekend. - Capt Kirk out (USAF 1989-1999)