Global Weather Summary for April 2016
April 2016 is in the weather history books. There were a lot of challenges for businesses and especially farmers around the world.
Here in the U.S. April overall was cooler than last year for the Eastern half of the country with the Northeast the real cool spot, trending coldest and snowiest in 9 years while the other end of the country was the warmest in 25+ years in the Pacific Northwest. 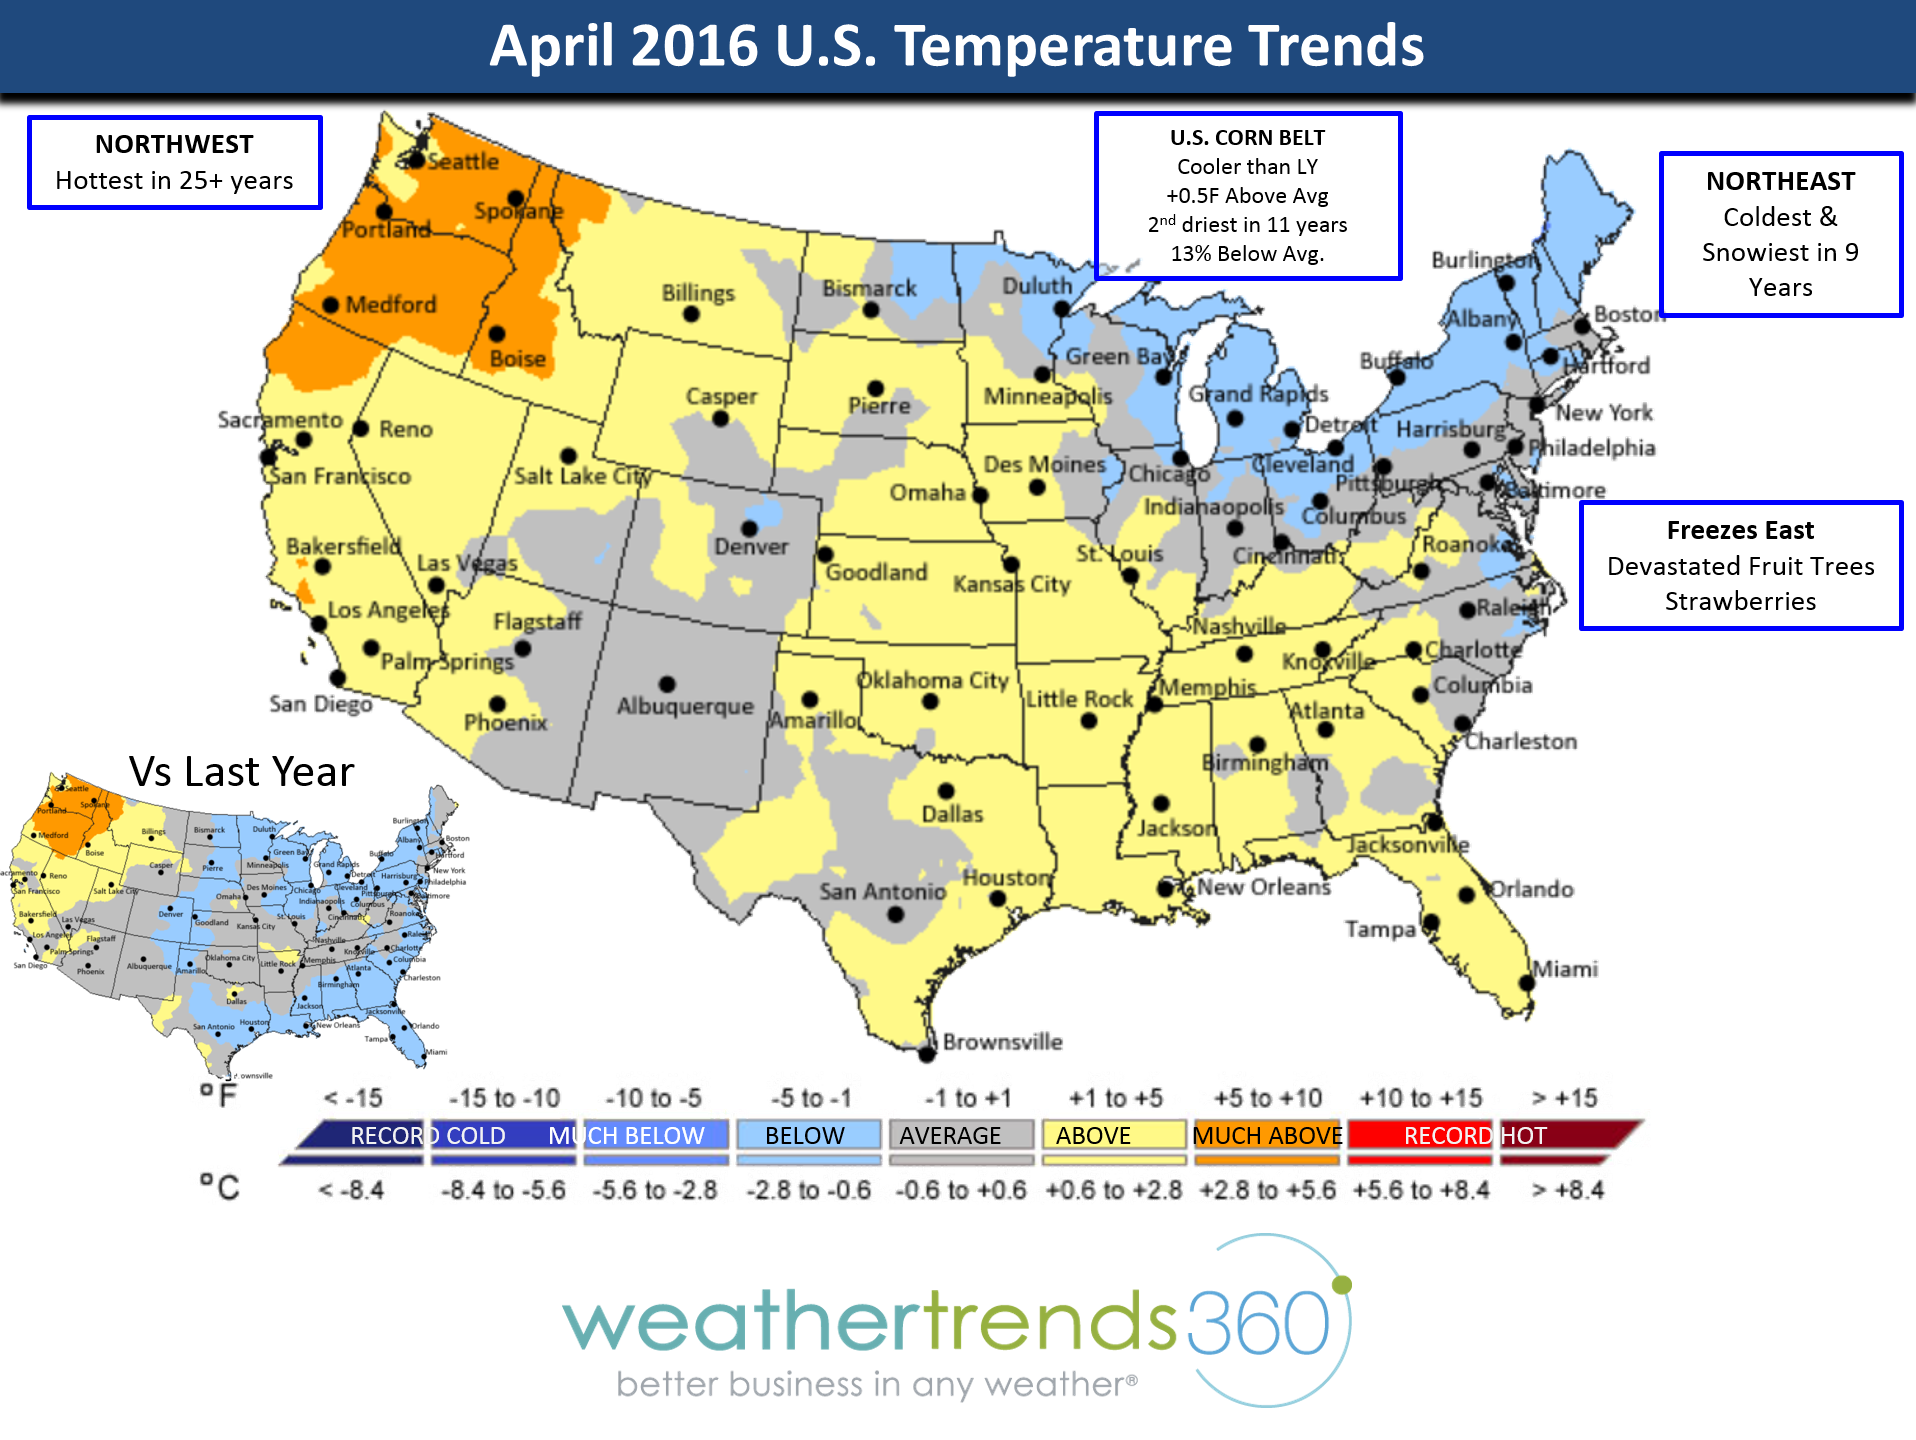
There were several devastating freezes in the East with so much vegetation emerging 3-4 weeks early this year due to the record warm Winter and 2nd Warmest March in 121 years. The 4th -10th was particularly devastating with many days of low temps in the 15F to 28F range with freezes all the way into South Carolina on the 6th and 10th. Many fruit tree farmers in the region are expecting major losses. Temperatures moderated significantly for the later half of the month. The Plains also had some freezes mid-month with patchy frost late in the month in the Midwest.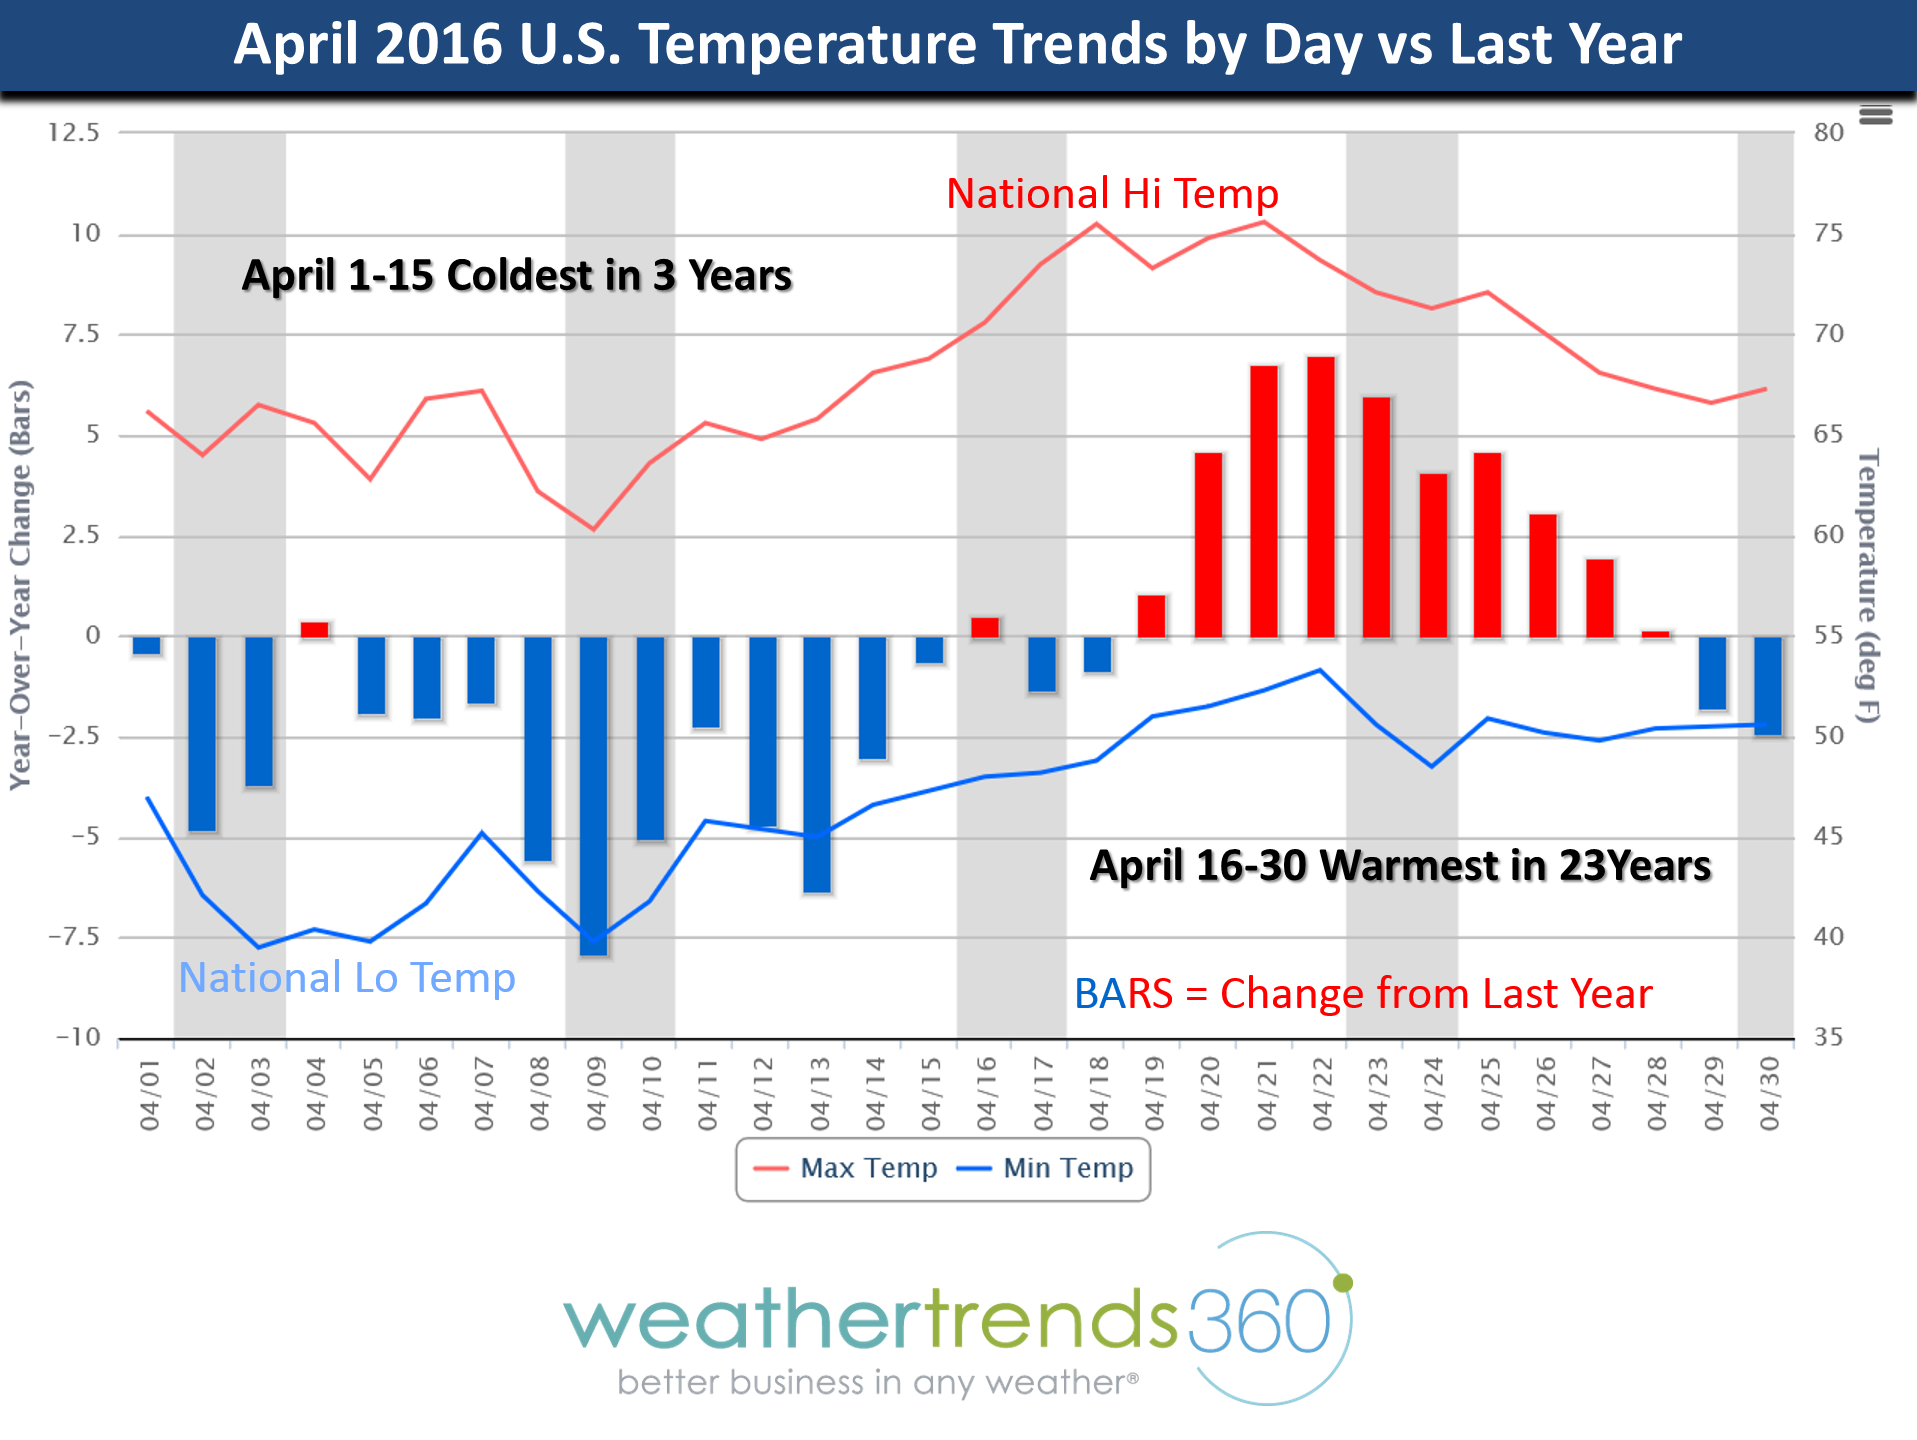
For the U.S. as a whole April ended up +0.8F warmer than average but -0.7F colder than last year.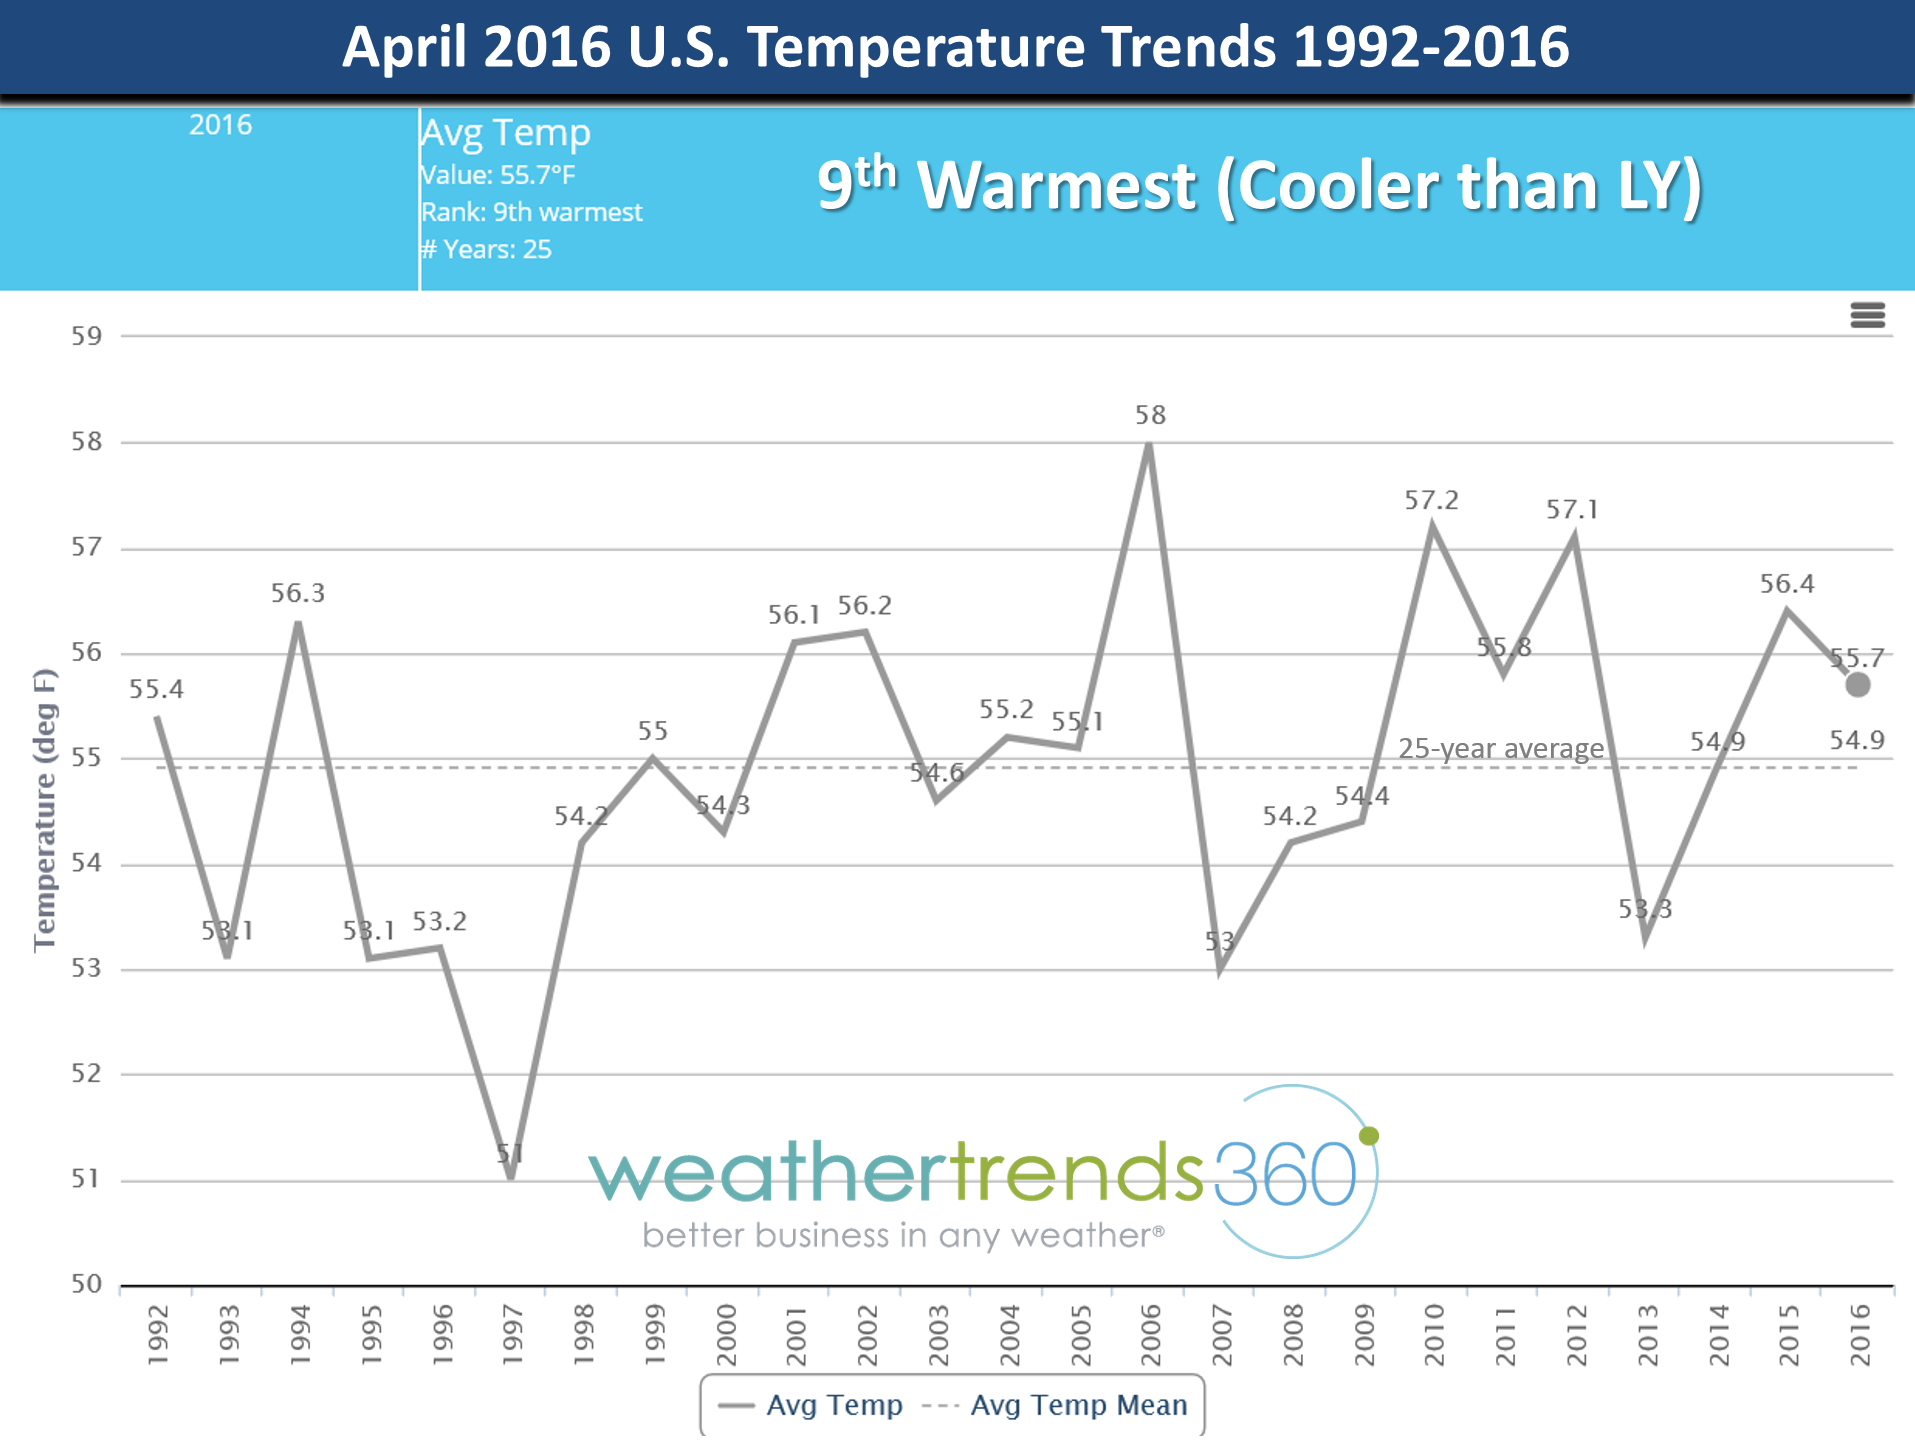
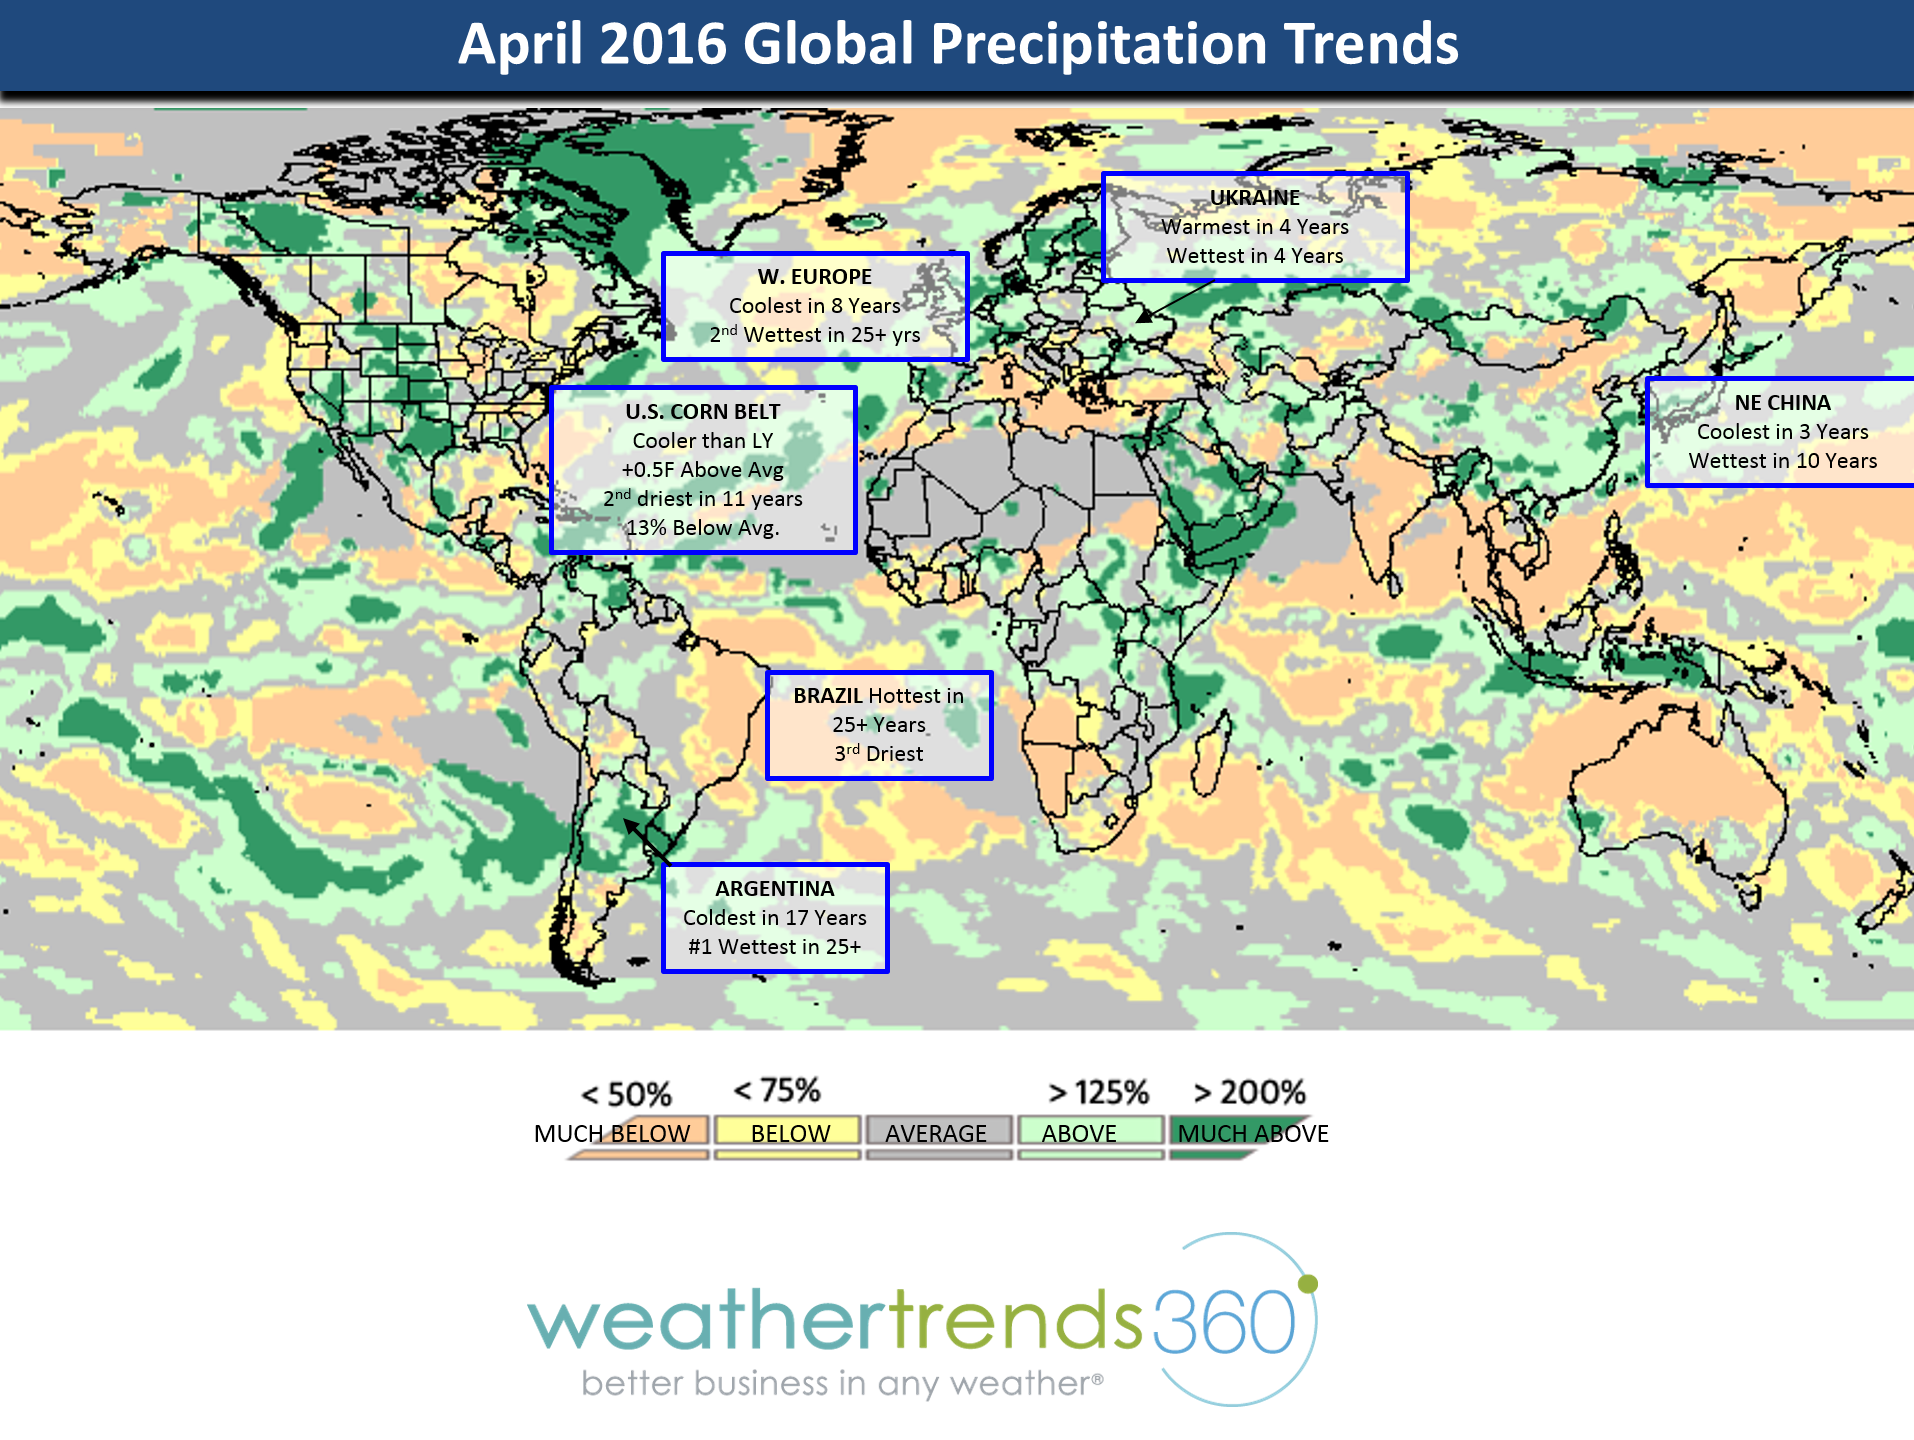
Globally there were all sorts of impacts to farmers especially with major freezes in France destroying much of the grapes - not a good year for French wines. Brazil ended up the hottest in over 25+ years with major negative impacts to their Corn Crops that were pollinating right in the middle of a 3-week hot/dry stretch of 90s.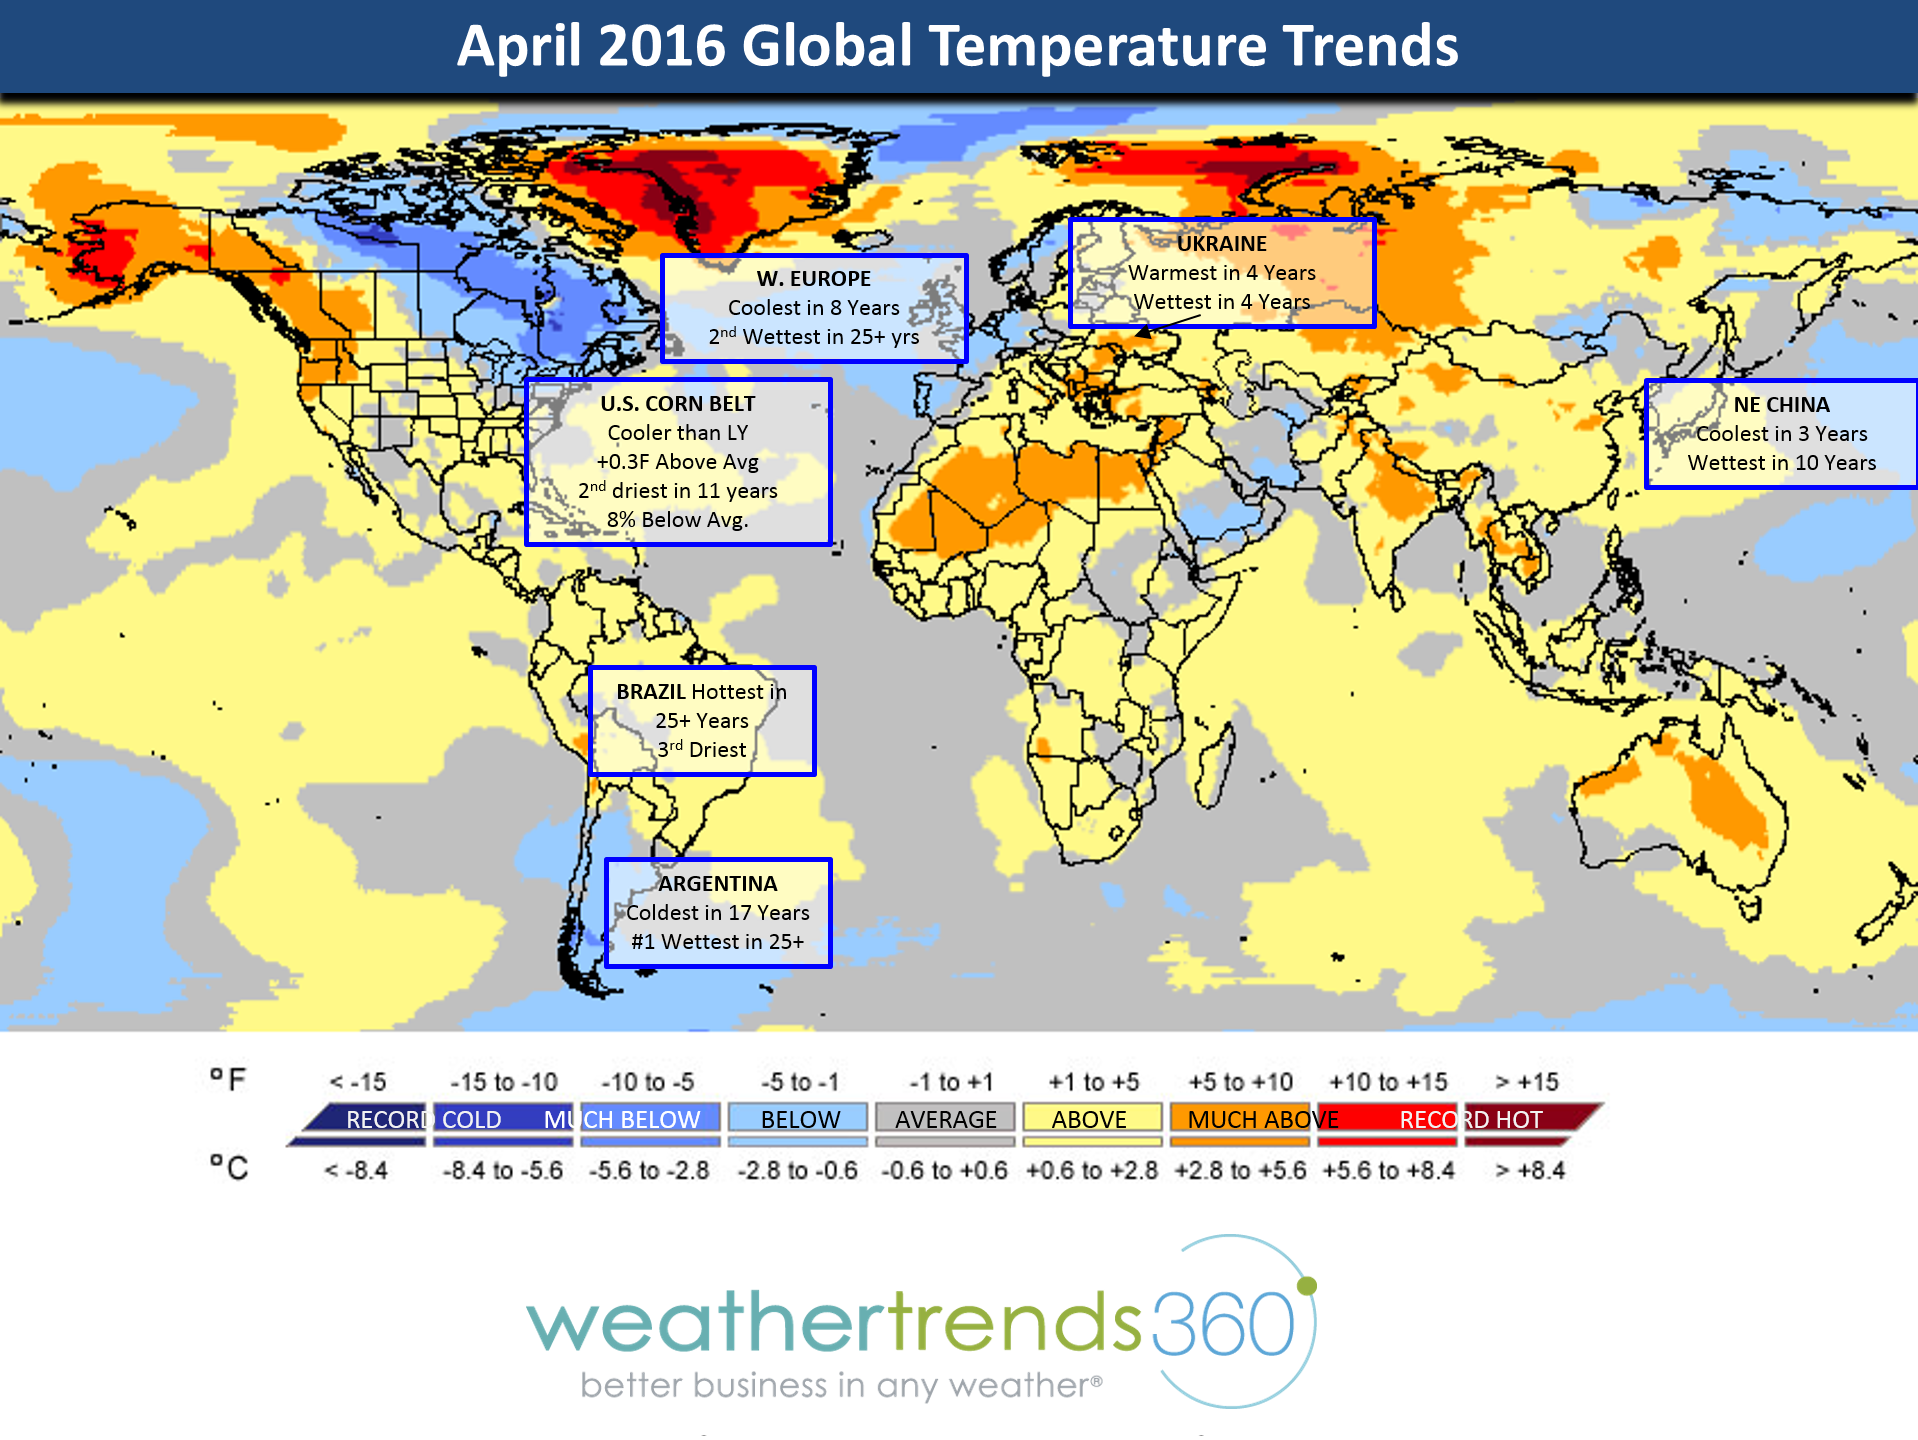
Rainfall in the U.S. was feast or famine with the Central Plains from Texas to South Dakota getting inundated, especially the Houston area where over 16" of rain fell during the month. In the Upper Midwest it was the driest in 12 years, the Northeast driest in 6 years. Parts of California had more heavy rain and heavy mountain snow - very unusual for April.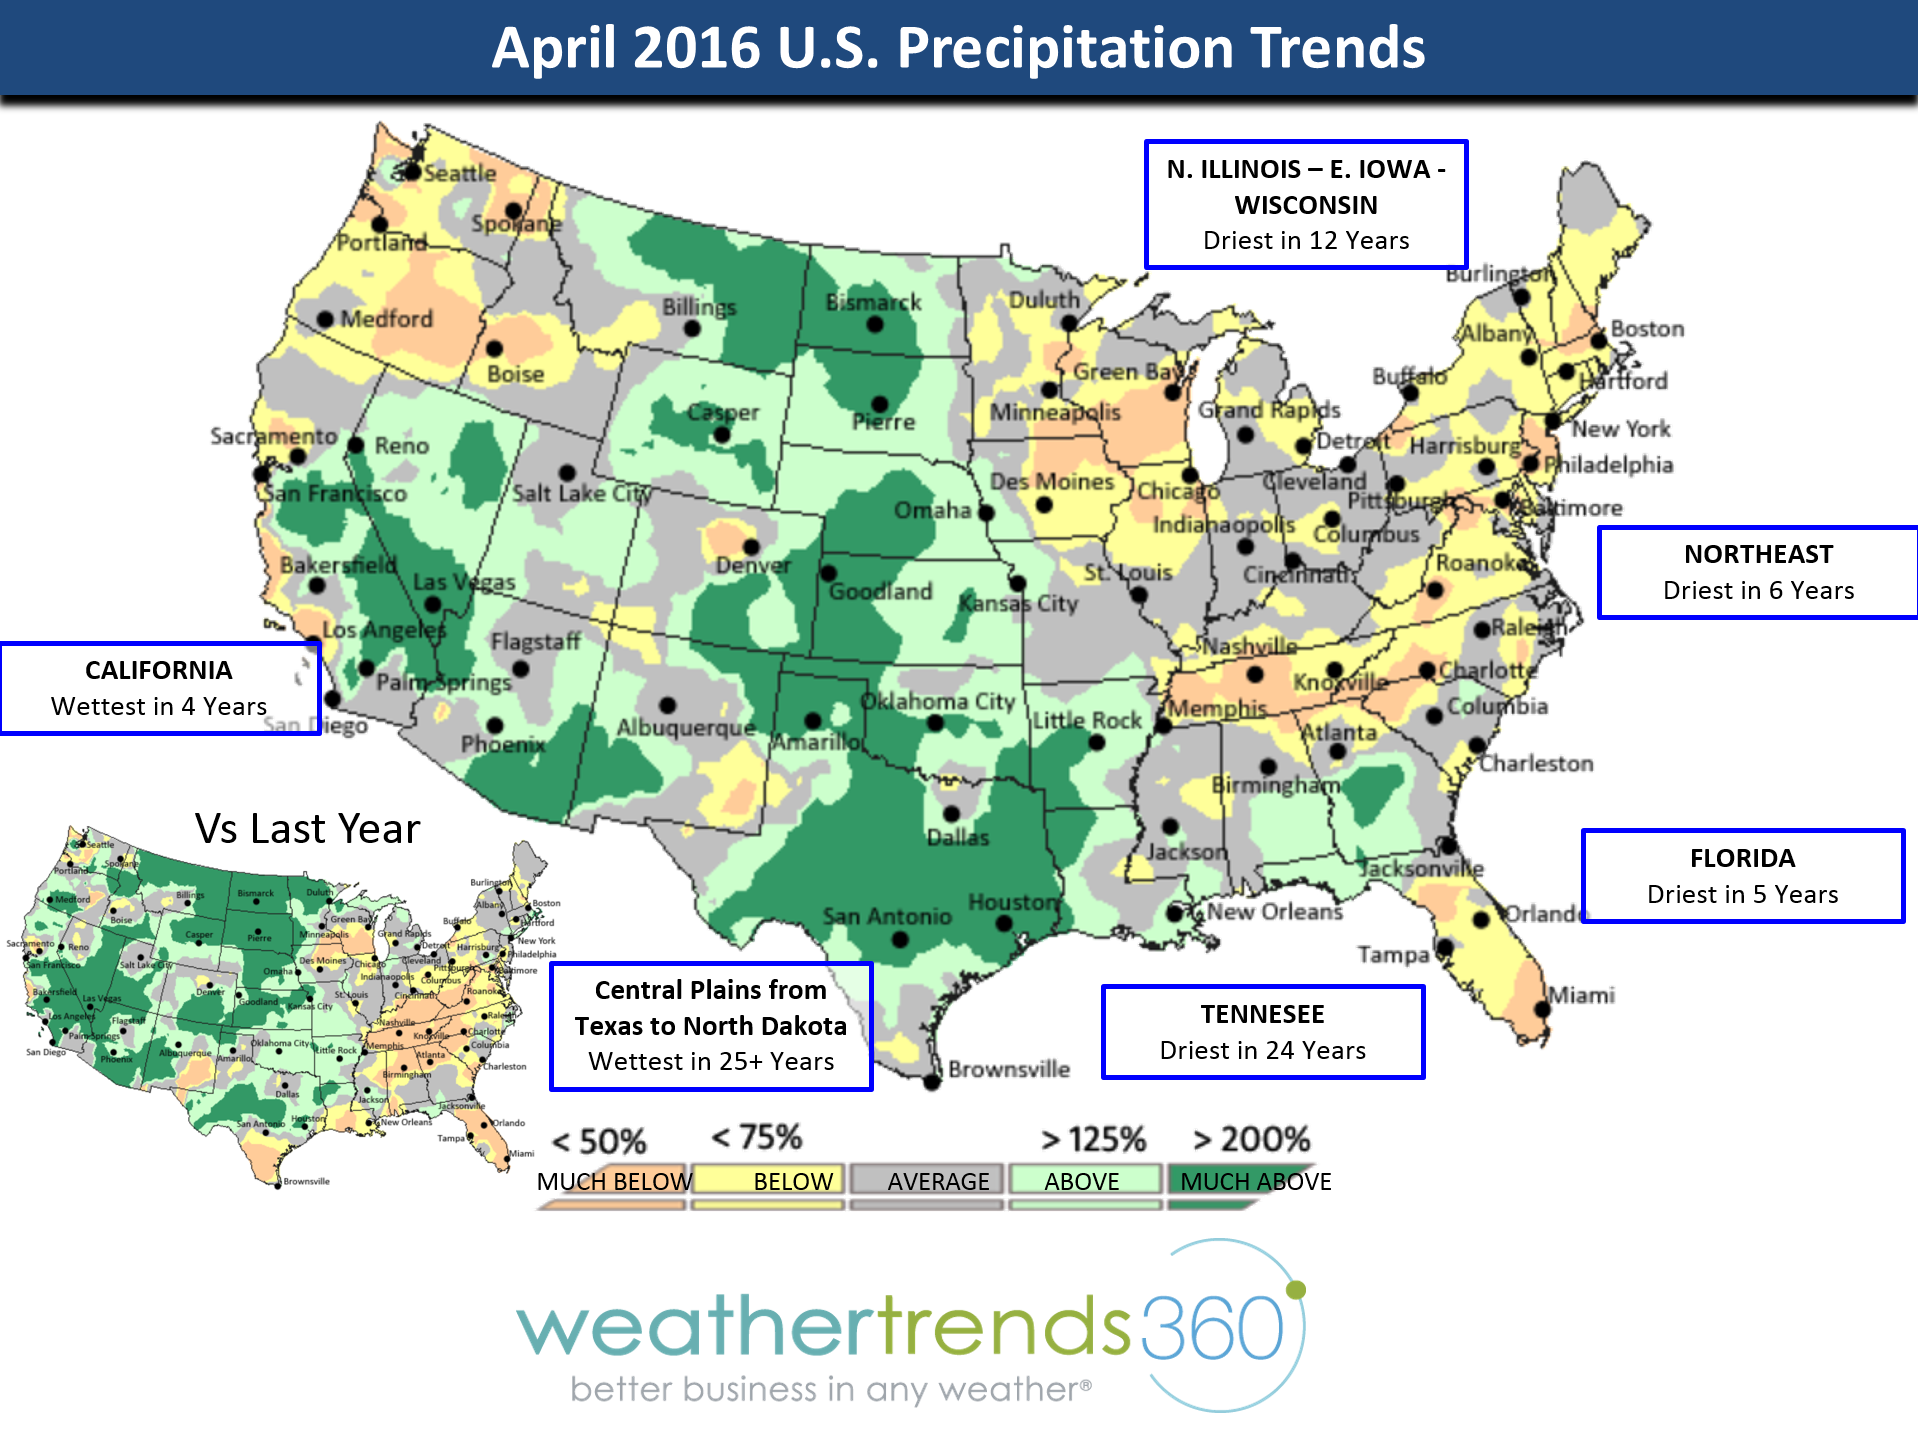
Day-by-Day the wettest periods nationally were the 11th, 18th and 30th.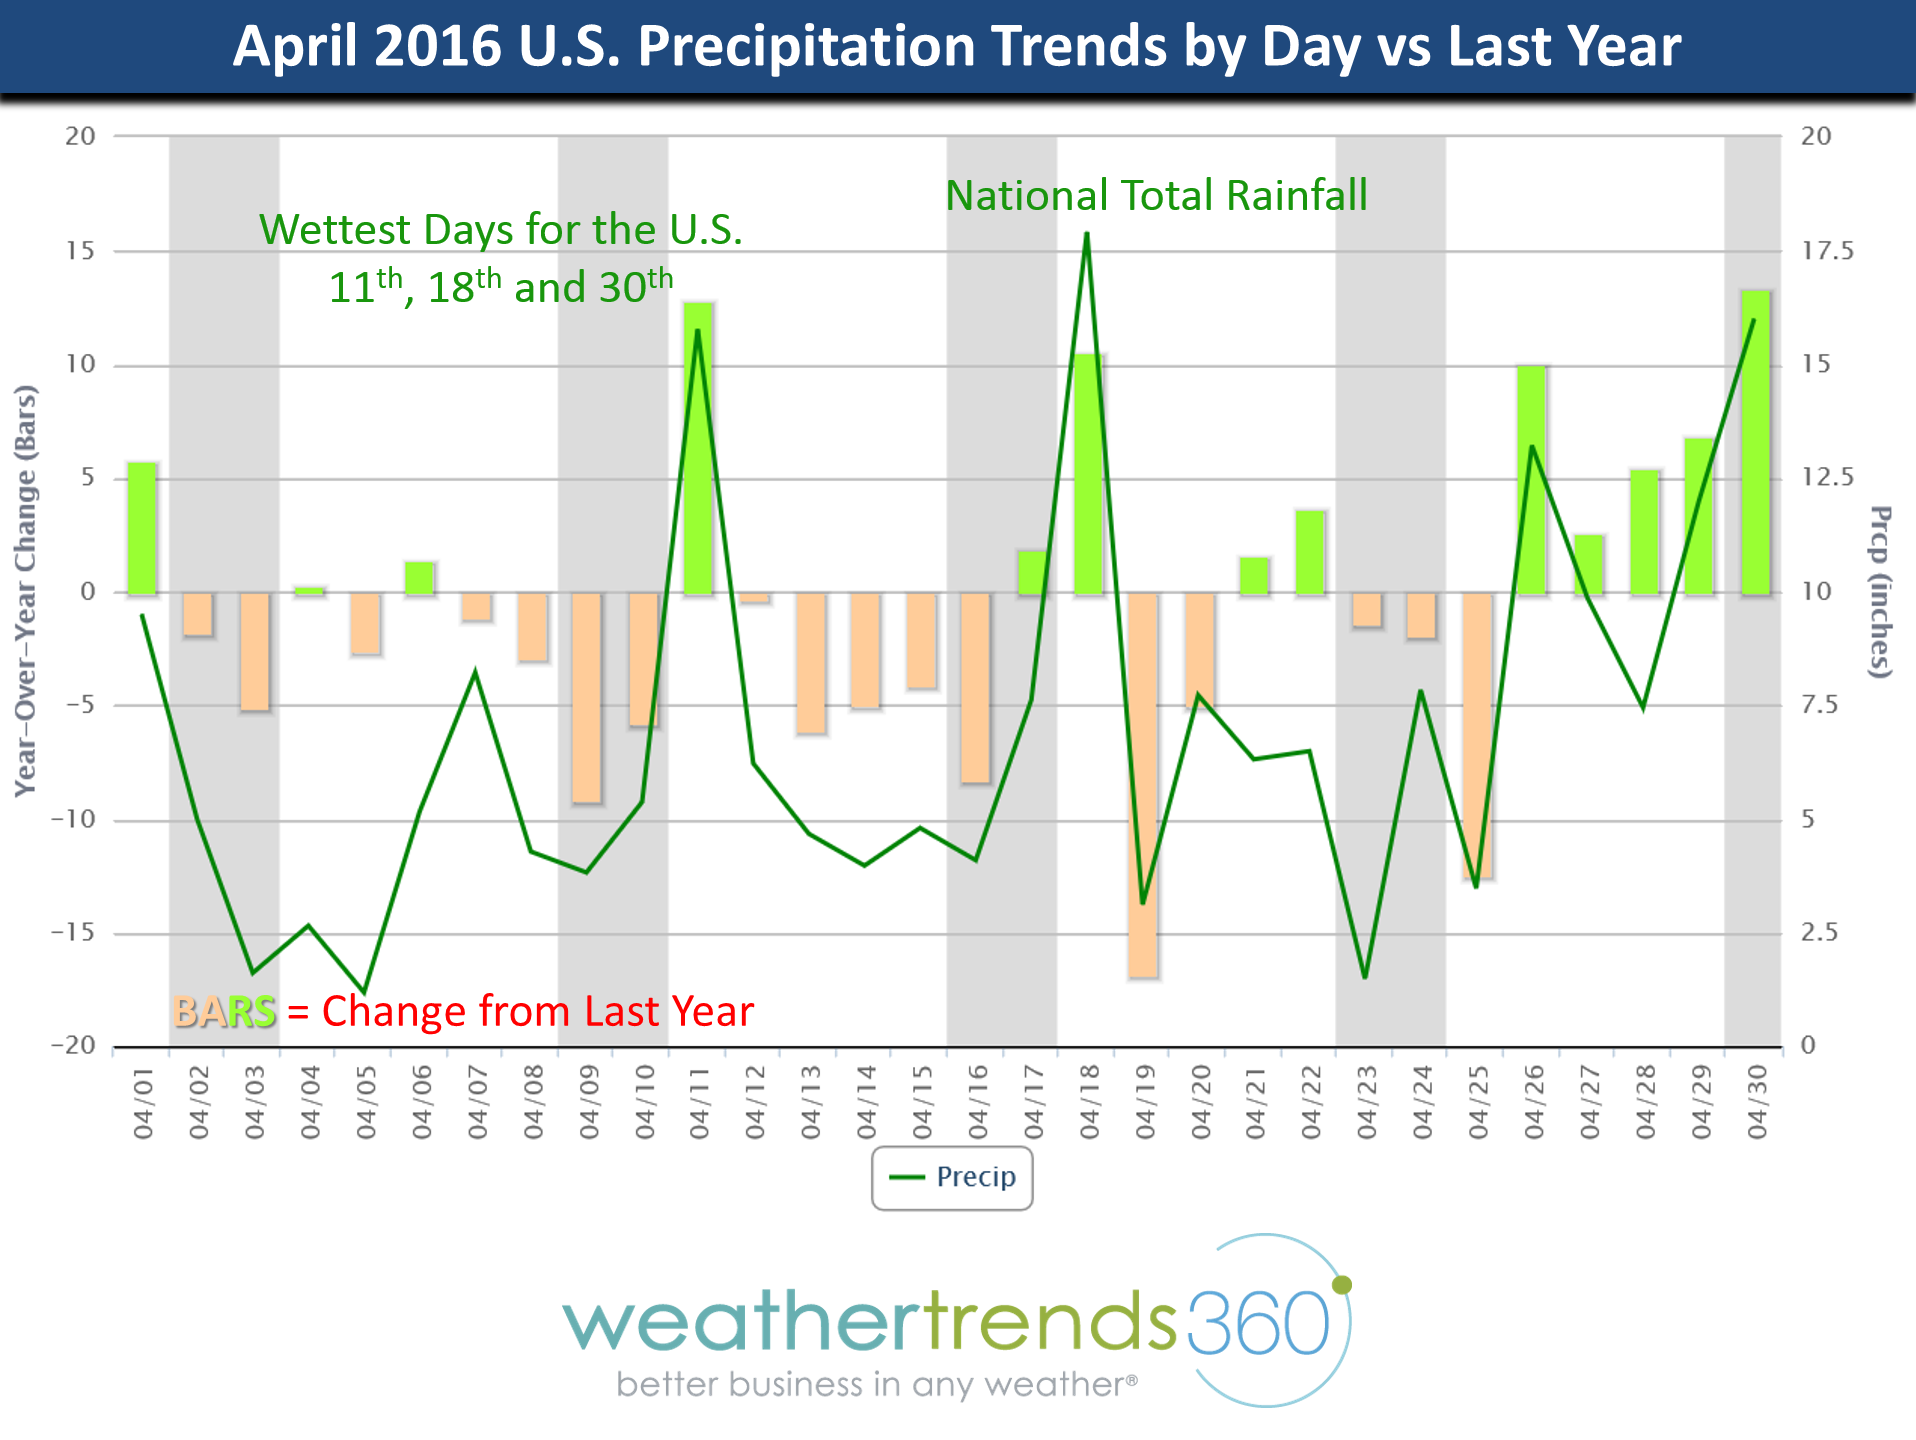
Despite the flooding rains in the Central U.S., the U.S. overall still had the driest April in 4 years but still above average. 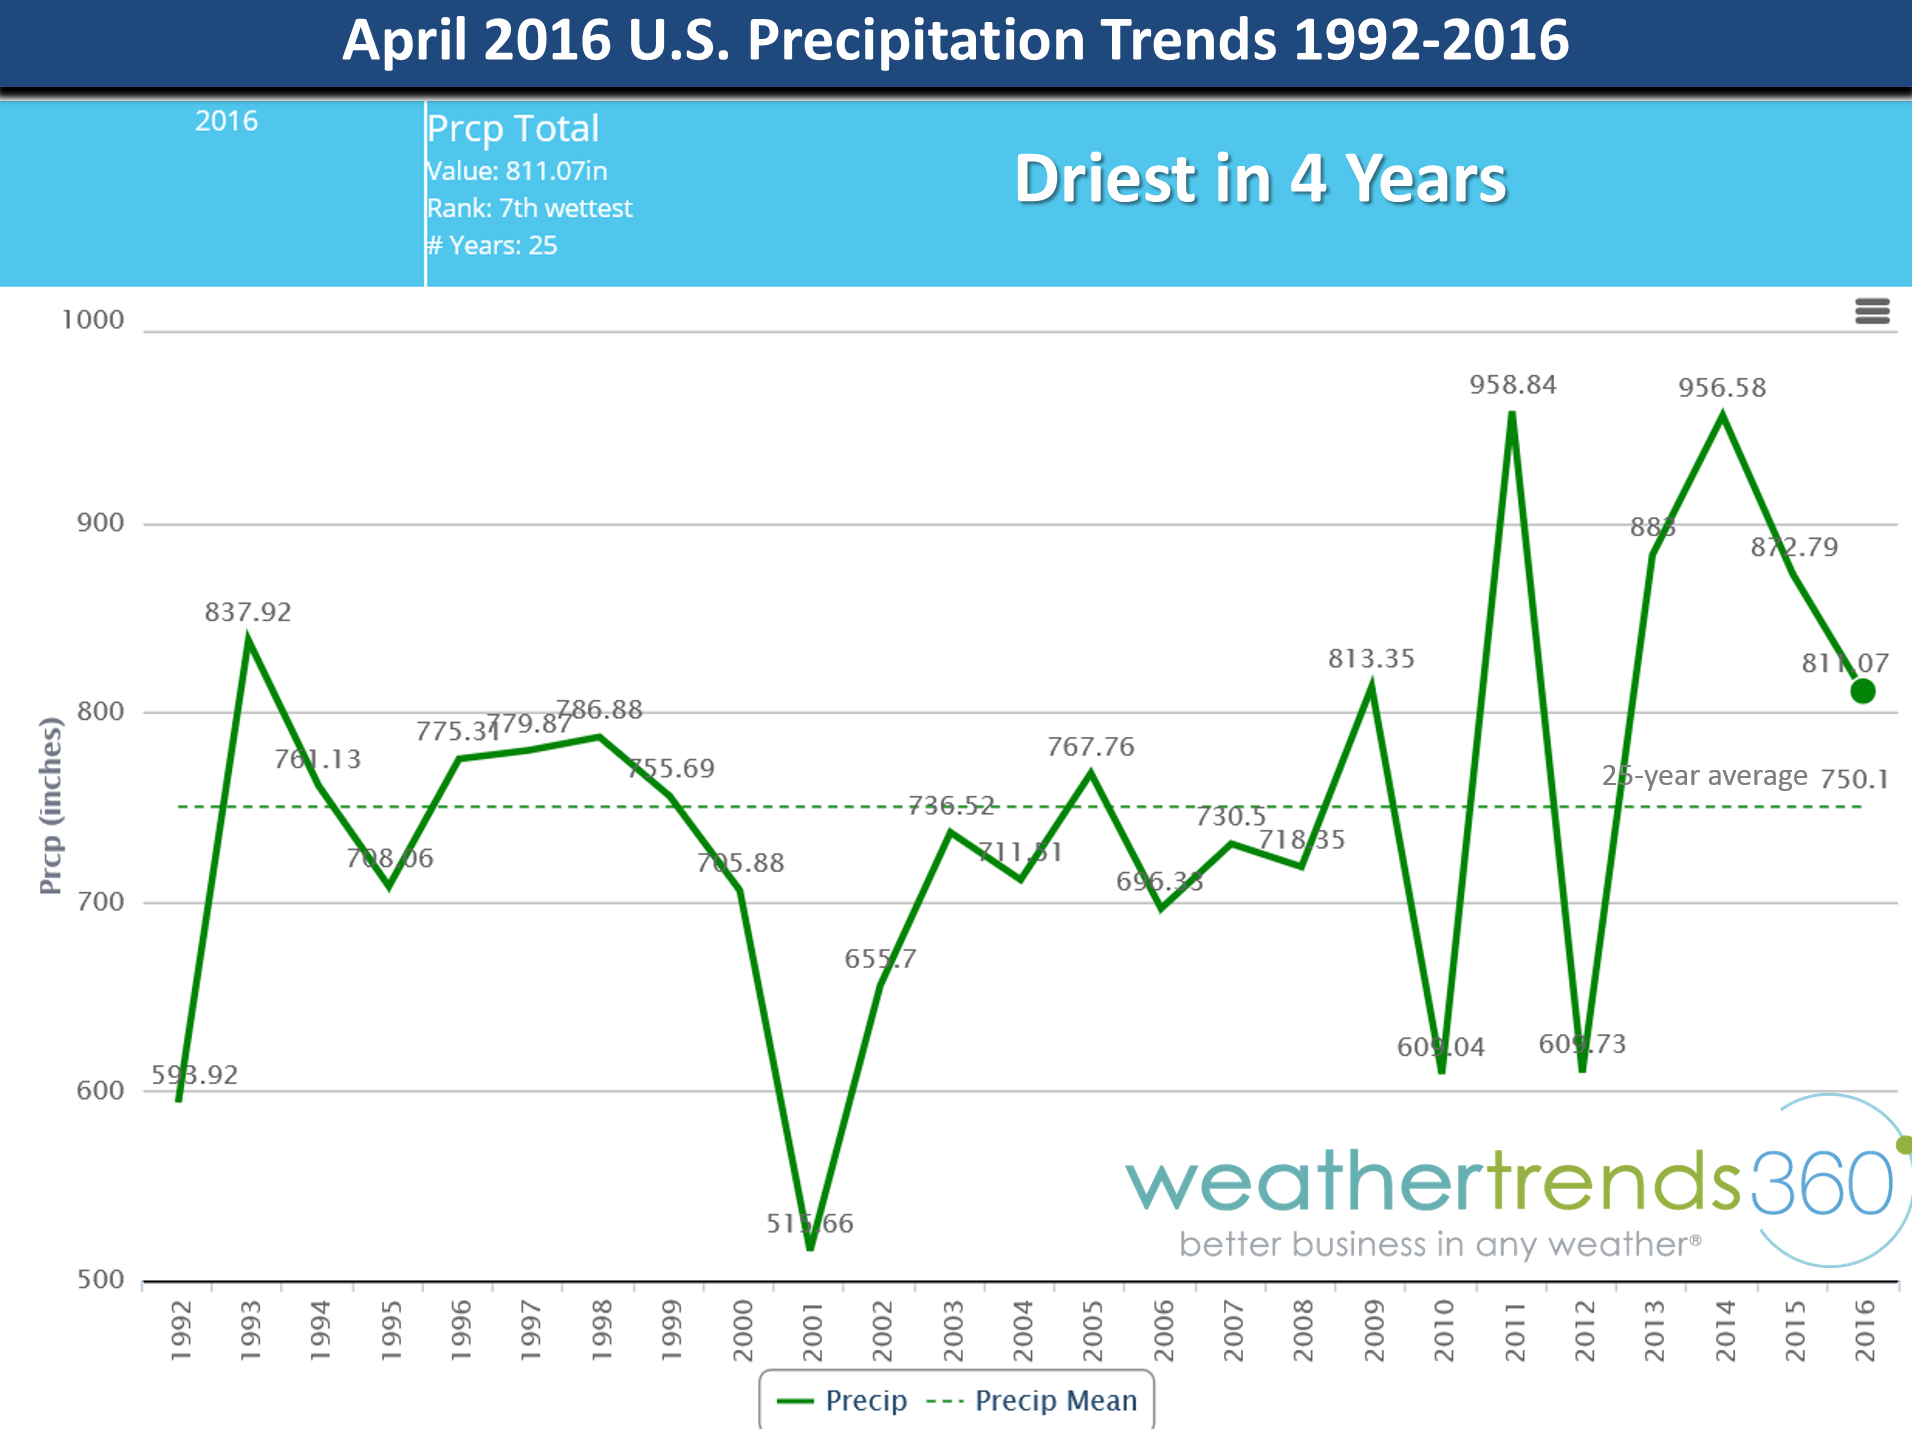
Snowfall was heaviest in the Northeast and the Rocky Mountains with the national index the most in 3 years and near average.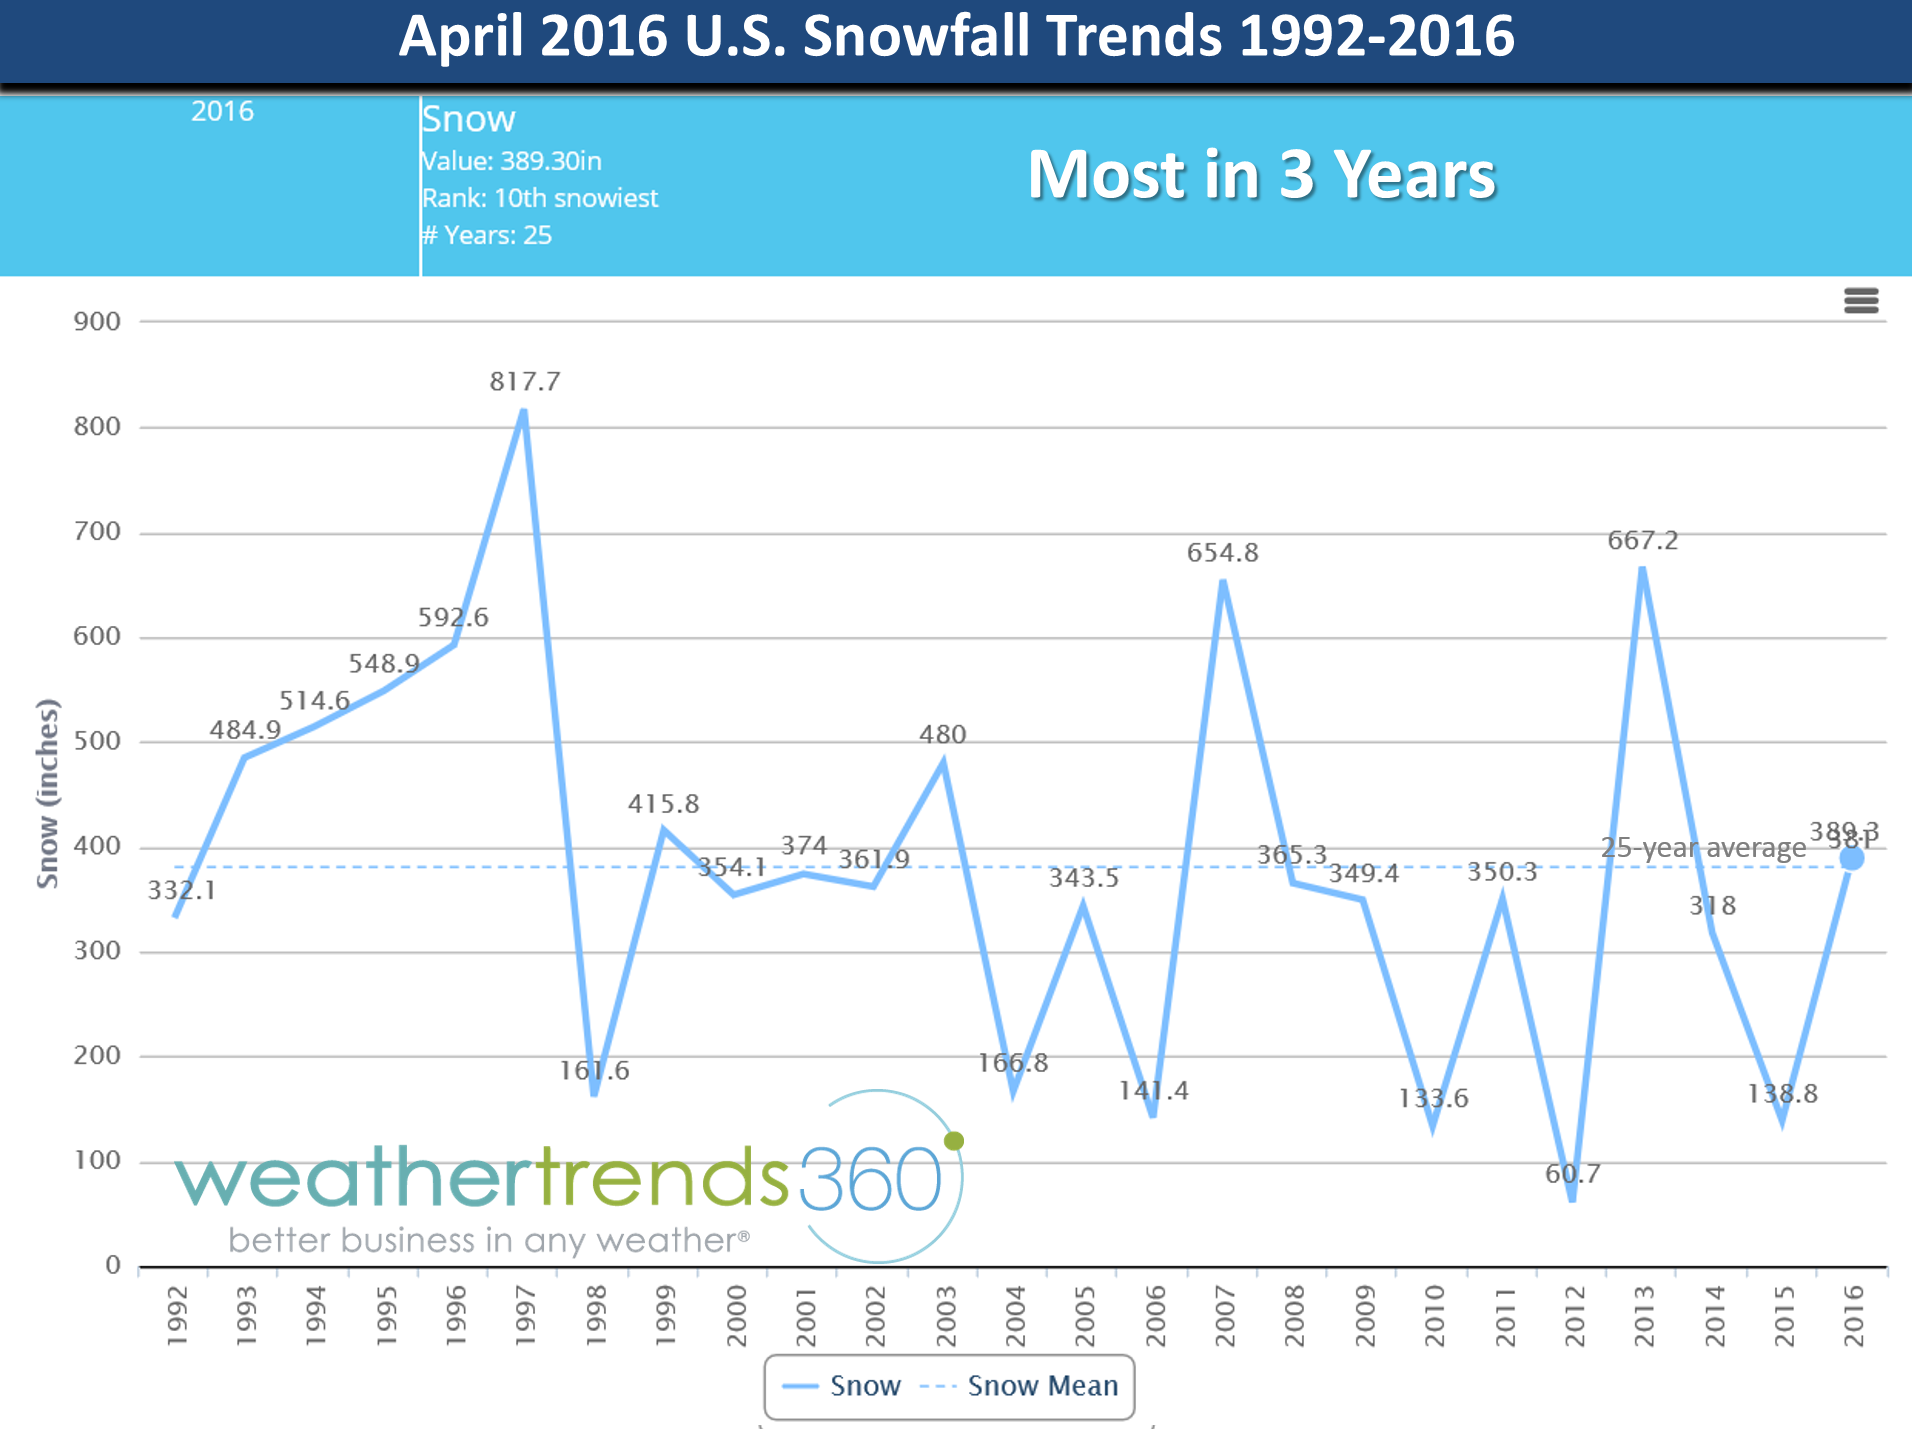
Globally rainfall was also excessive down in Argentina where it was the wettest in 17 years but in some areas record flooding. The SoyBean harvest was decimated with farmers unable to harvest with many crops lost which sent SoyBean prices soaring to 9 month highs while just to the north Brazil was being scorched with heat and very dry conditions.
Finally, it is very clear La Niña is forming at warp speed. Compared to this time last year the Pacific Ocean is cooling off very quickly with the Equatorial Pacific starting to show the classic cooler water temperatures associated with La Niña. 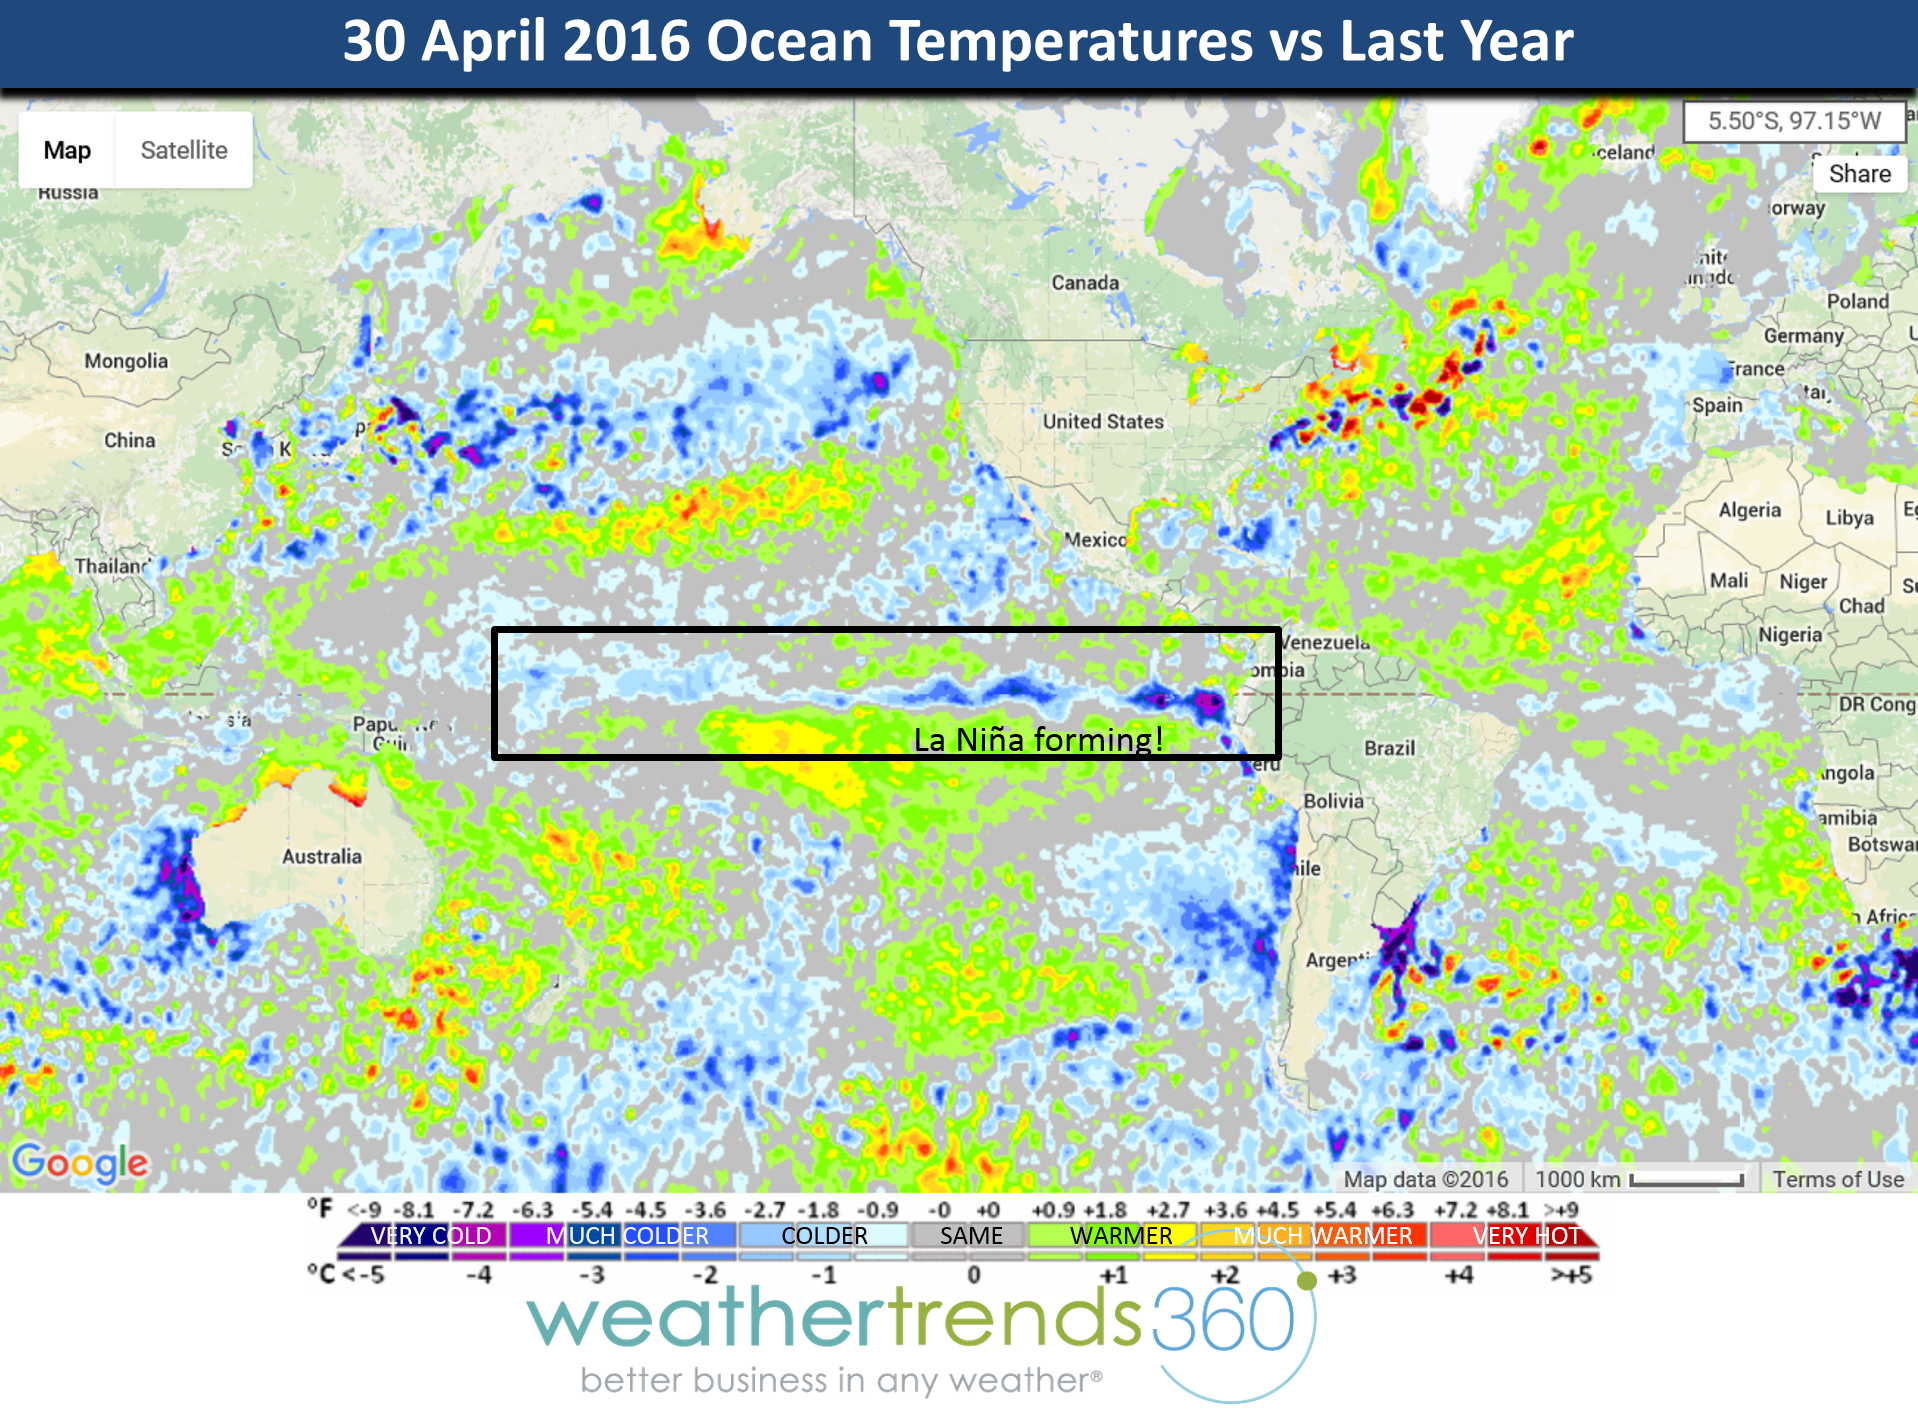
While NOAA said just a few weeks ago there is a 50% chance of La Nina, got'a love government thinking, in reality all signs point to near 100% certainty of a La Nina with weak conditions by June, moderate by July, strong by late Summer and potentially very strong by late Fall - Winter. Here's their latest model, common sense and empirical evidence suggest there is no doubt we're headed for a prolonged 2-year La Nina which bring hot/dry Summers and cold/dry Winters for the U.S. overall. 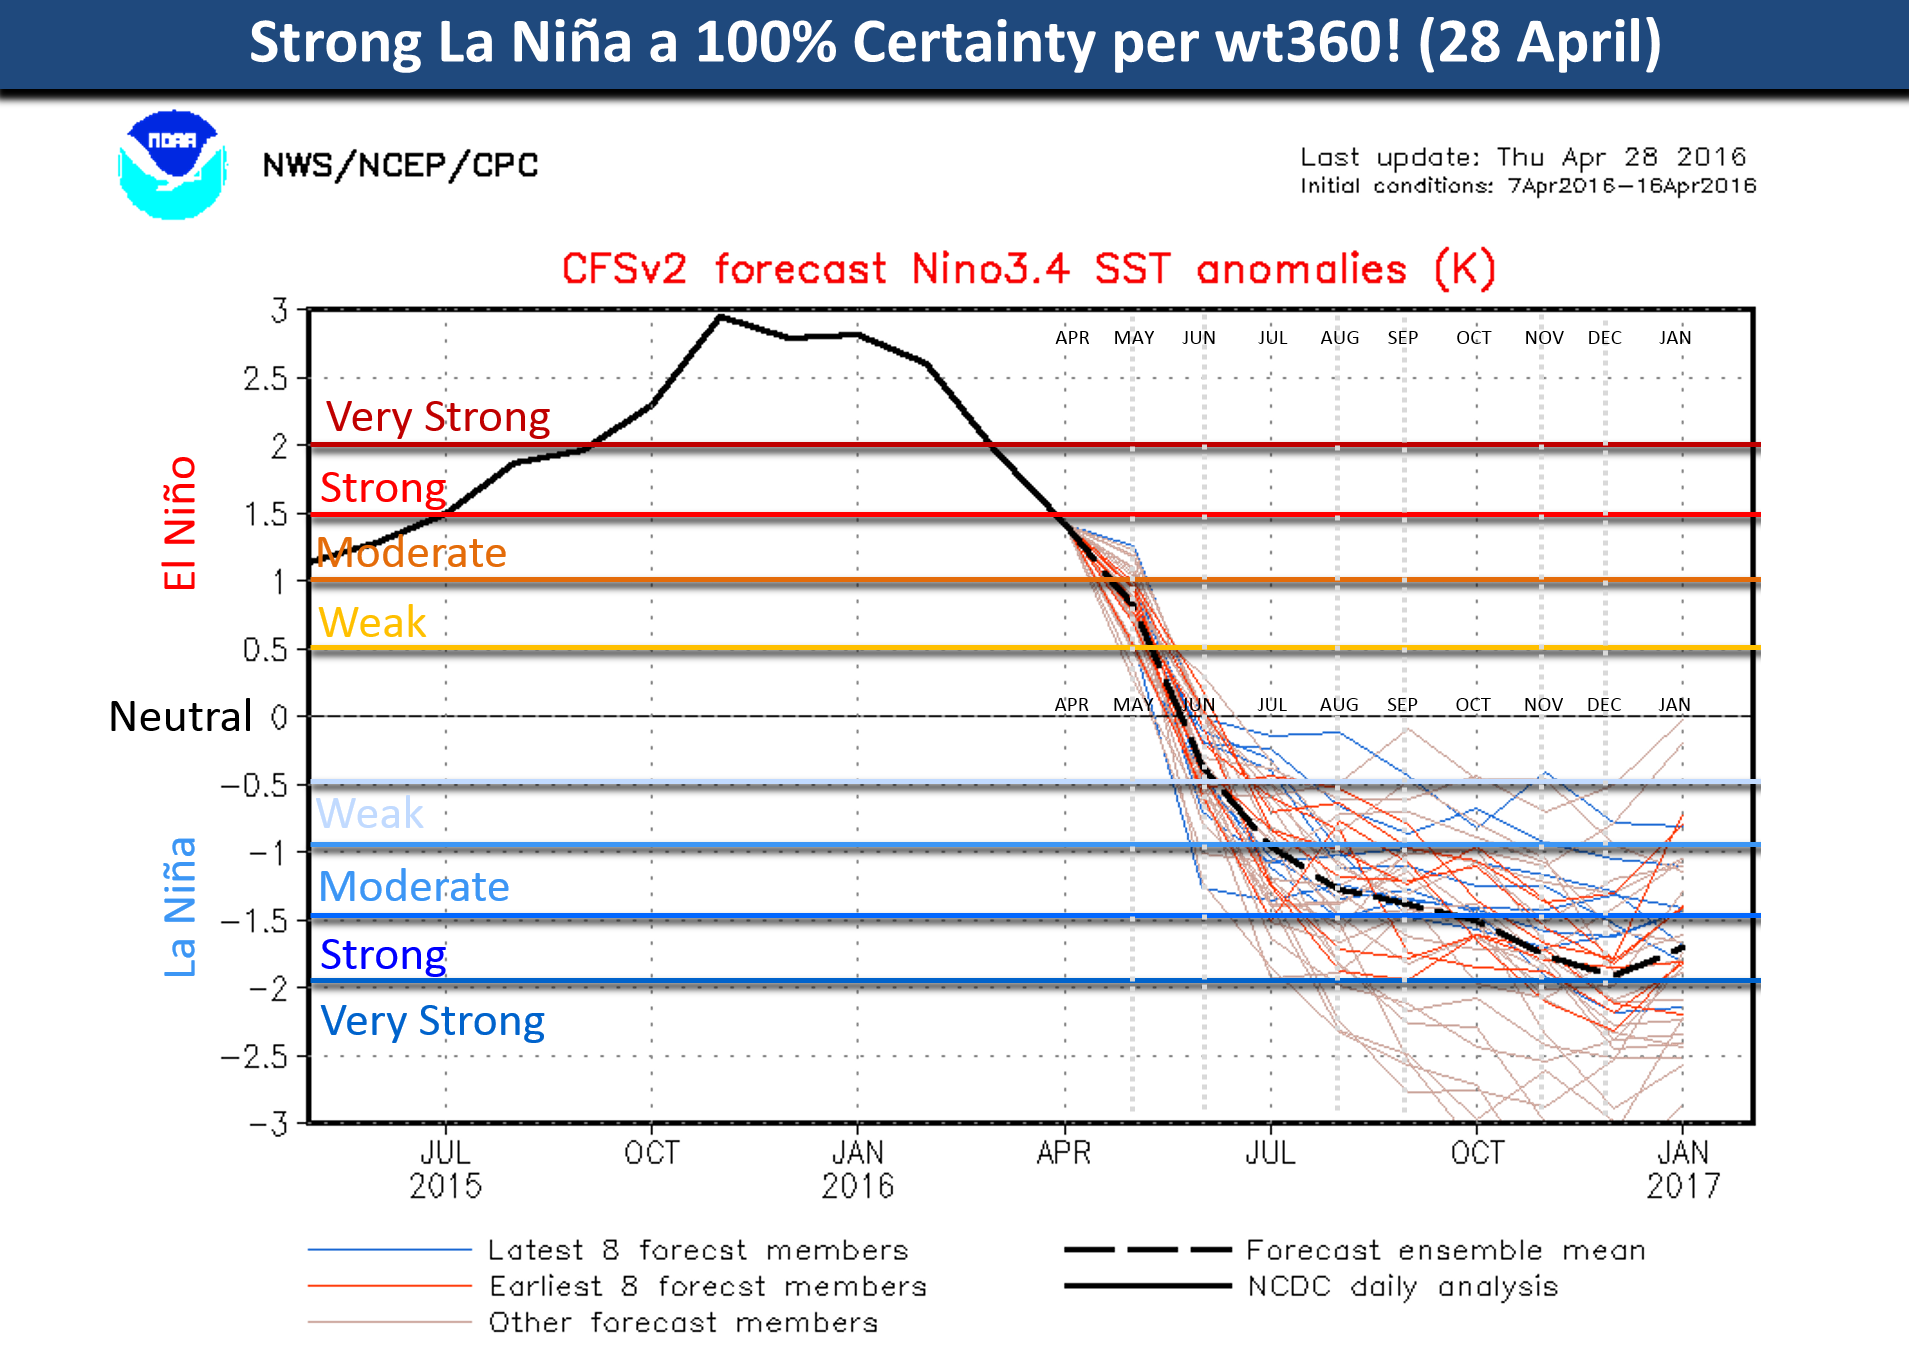
Have a great May folks! - Capt Kirk out.