Captain's Log 5 July 2021 Record Tropical Start
Captain's Log
Happy Monday! :)
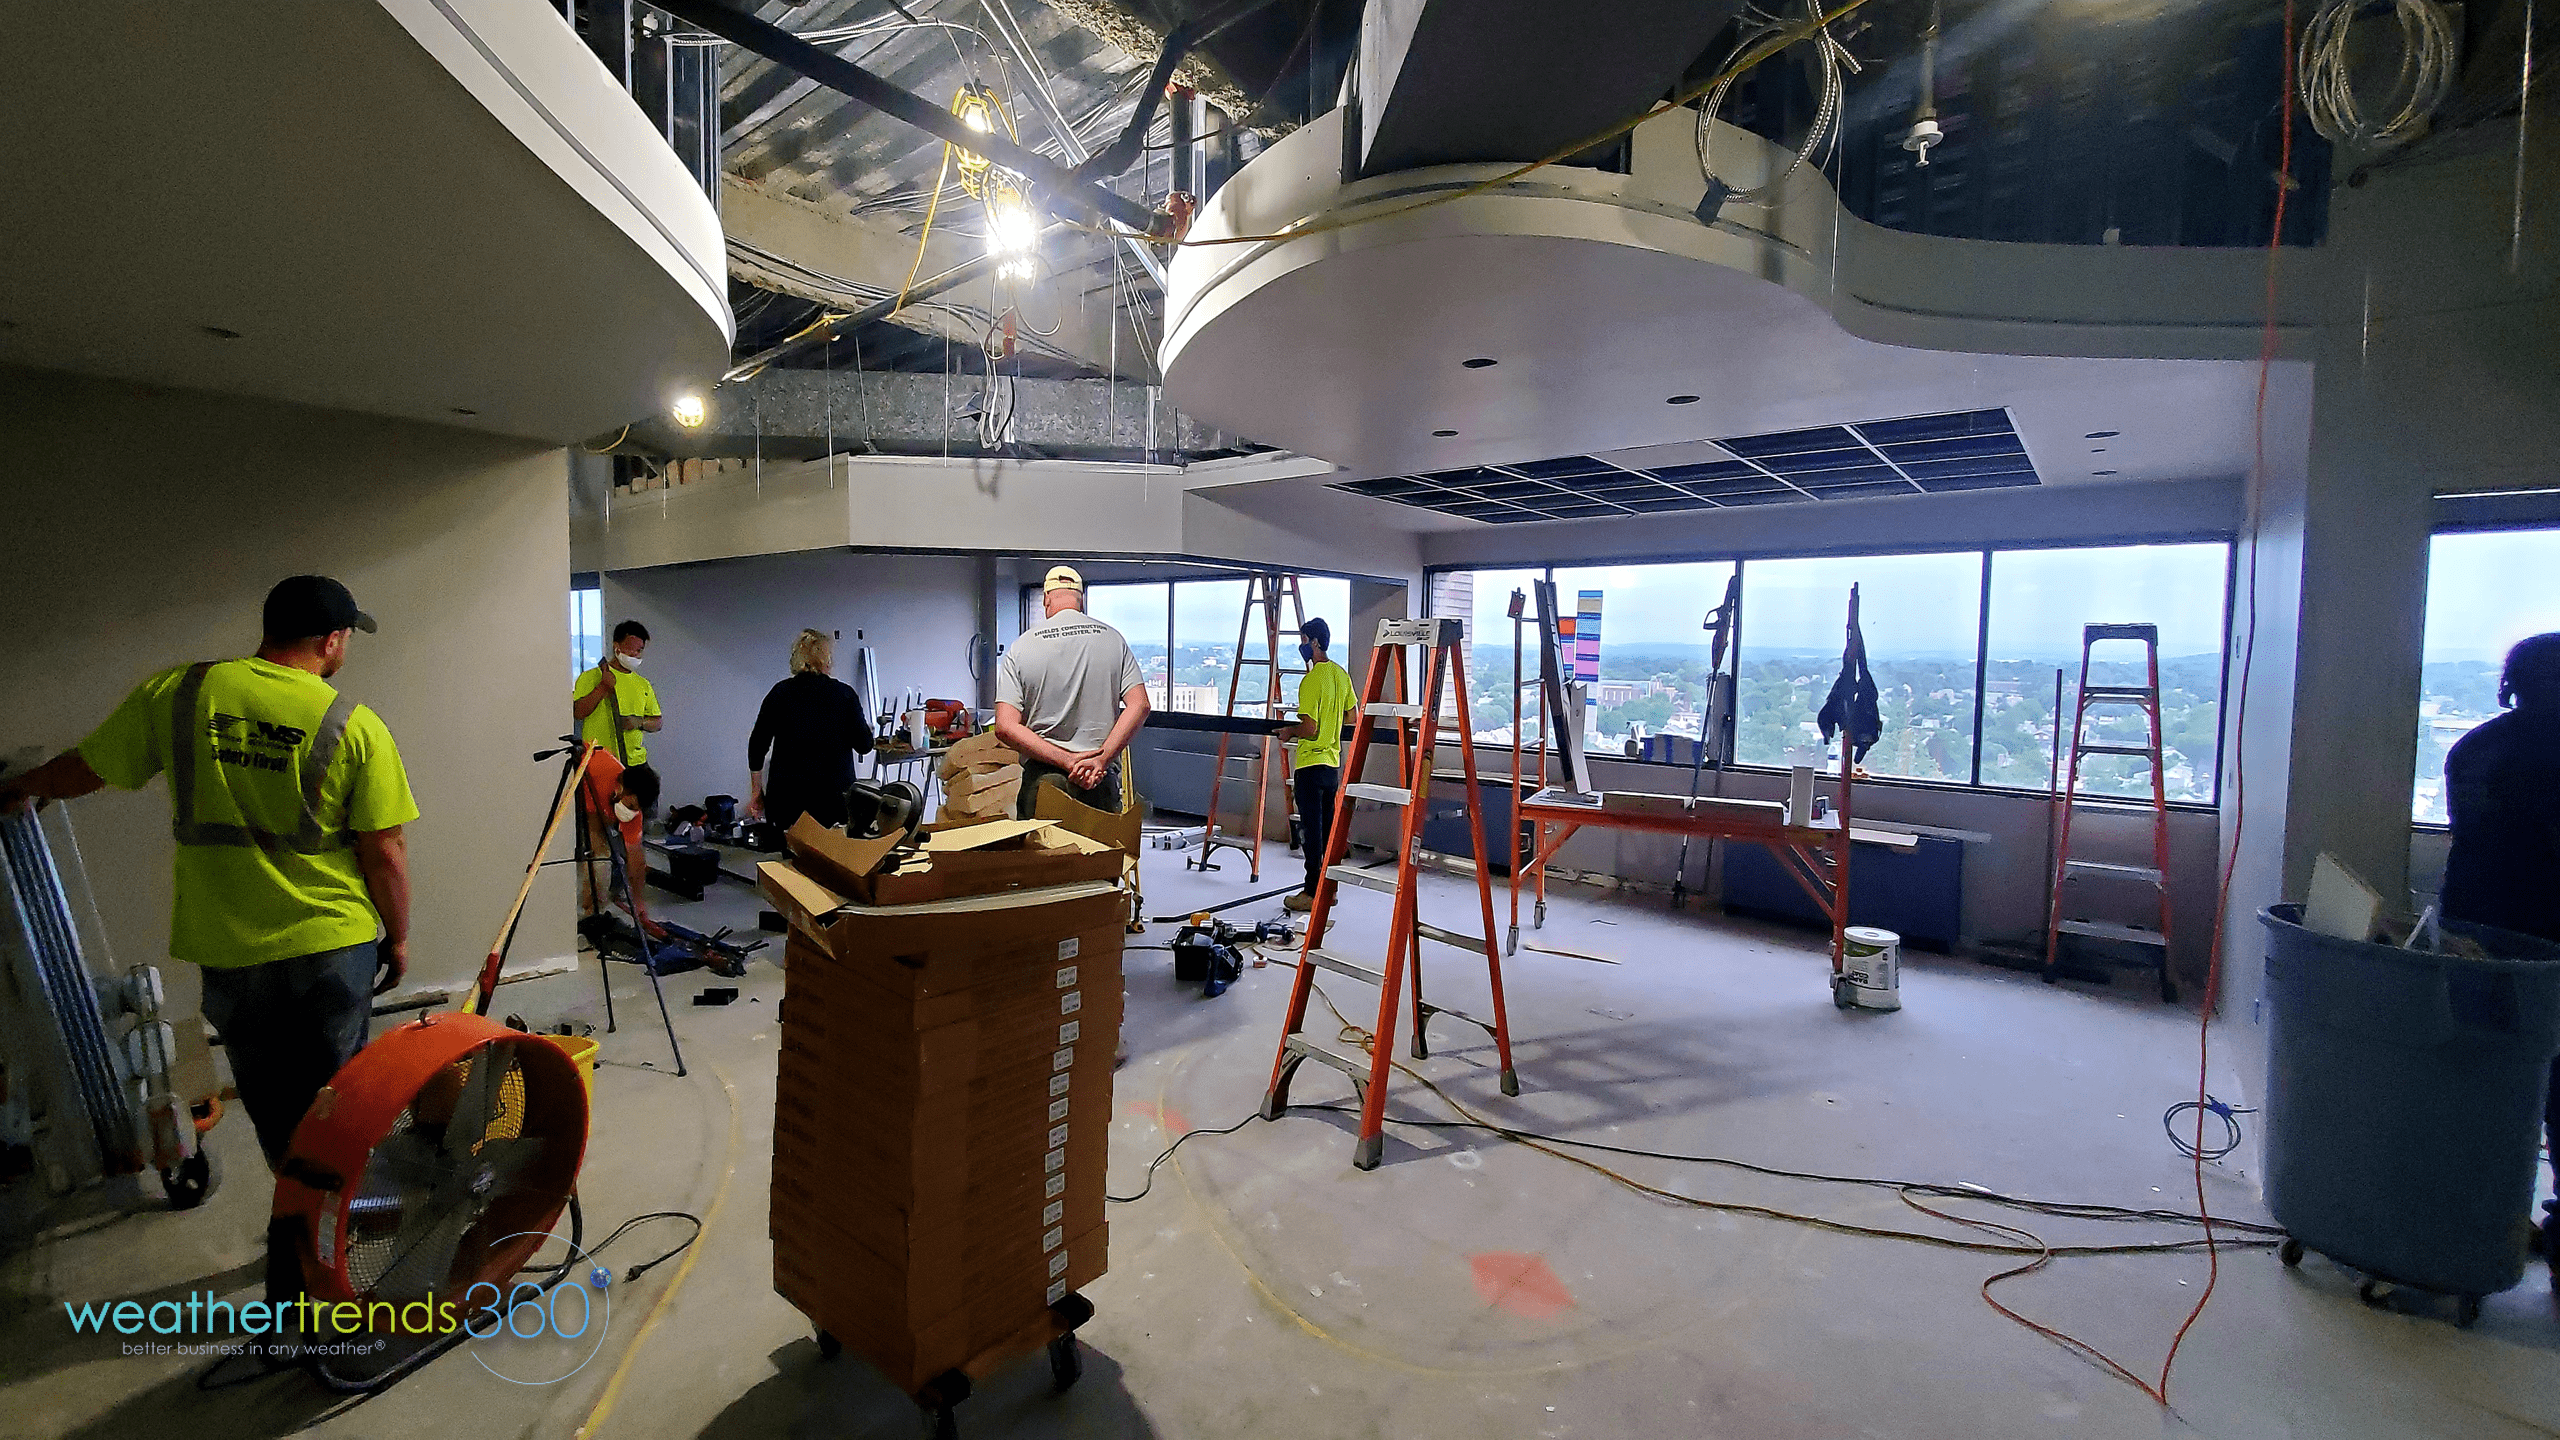
Less than a month to go until we move into our new Headquarters in downtown Bethlehem, PA! We have a panoramic view to the world up there on the 8th floor and can't wait to move in. CLICK ON IMAGES FOR A LARGER VIEW.
Last week (27 June - 3 July) across the World shows the U.S. trending -0.2F cooler than last year, coolest in 4 years but still 6th hottest of the past 36 years with well above average national temperatures. Rainfall was the most in 36 years with very wet conditions across the South but remaining very dry across the West and North.
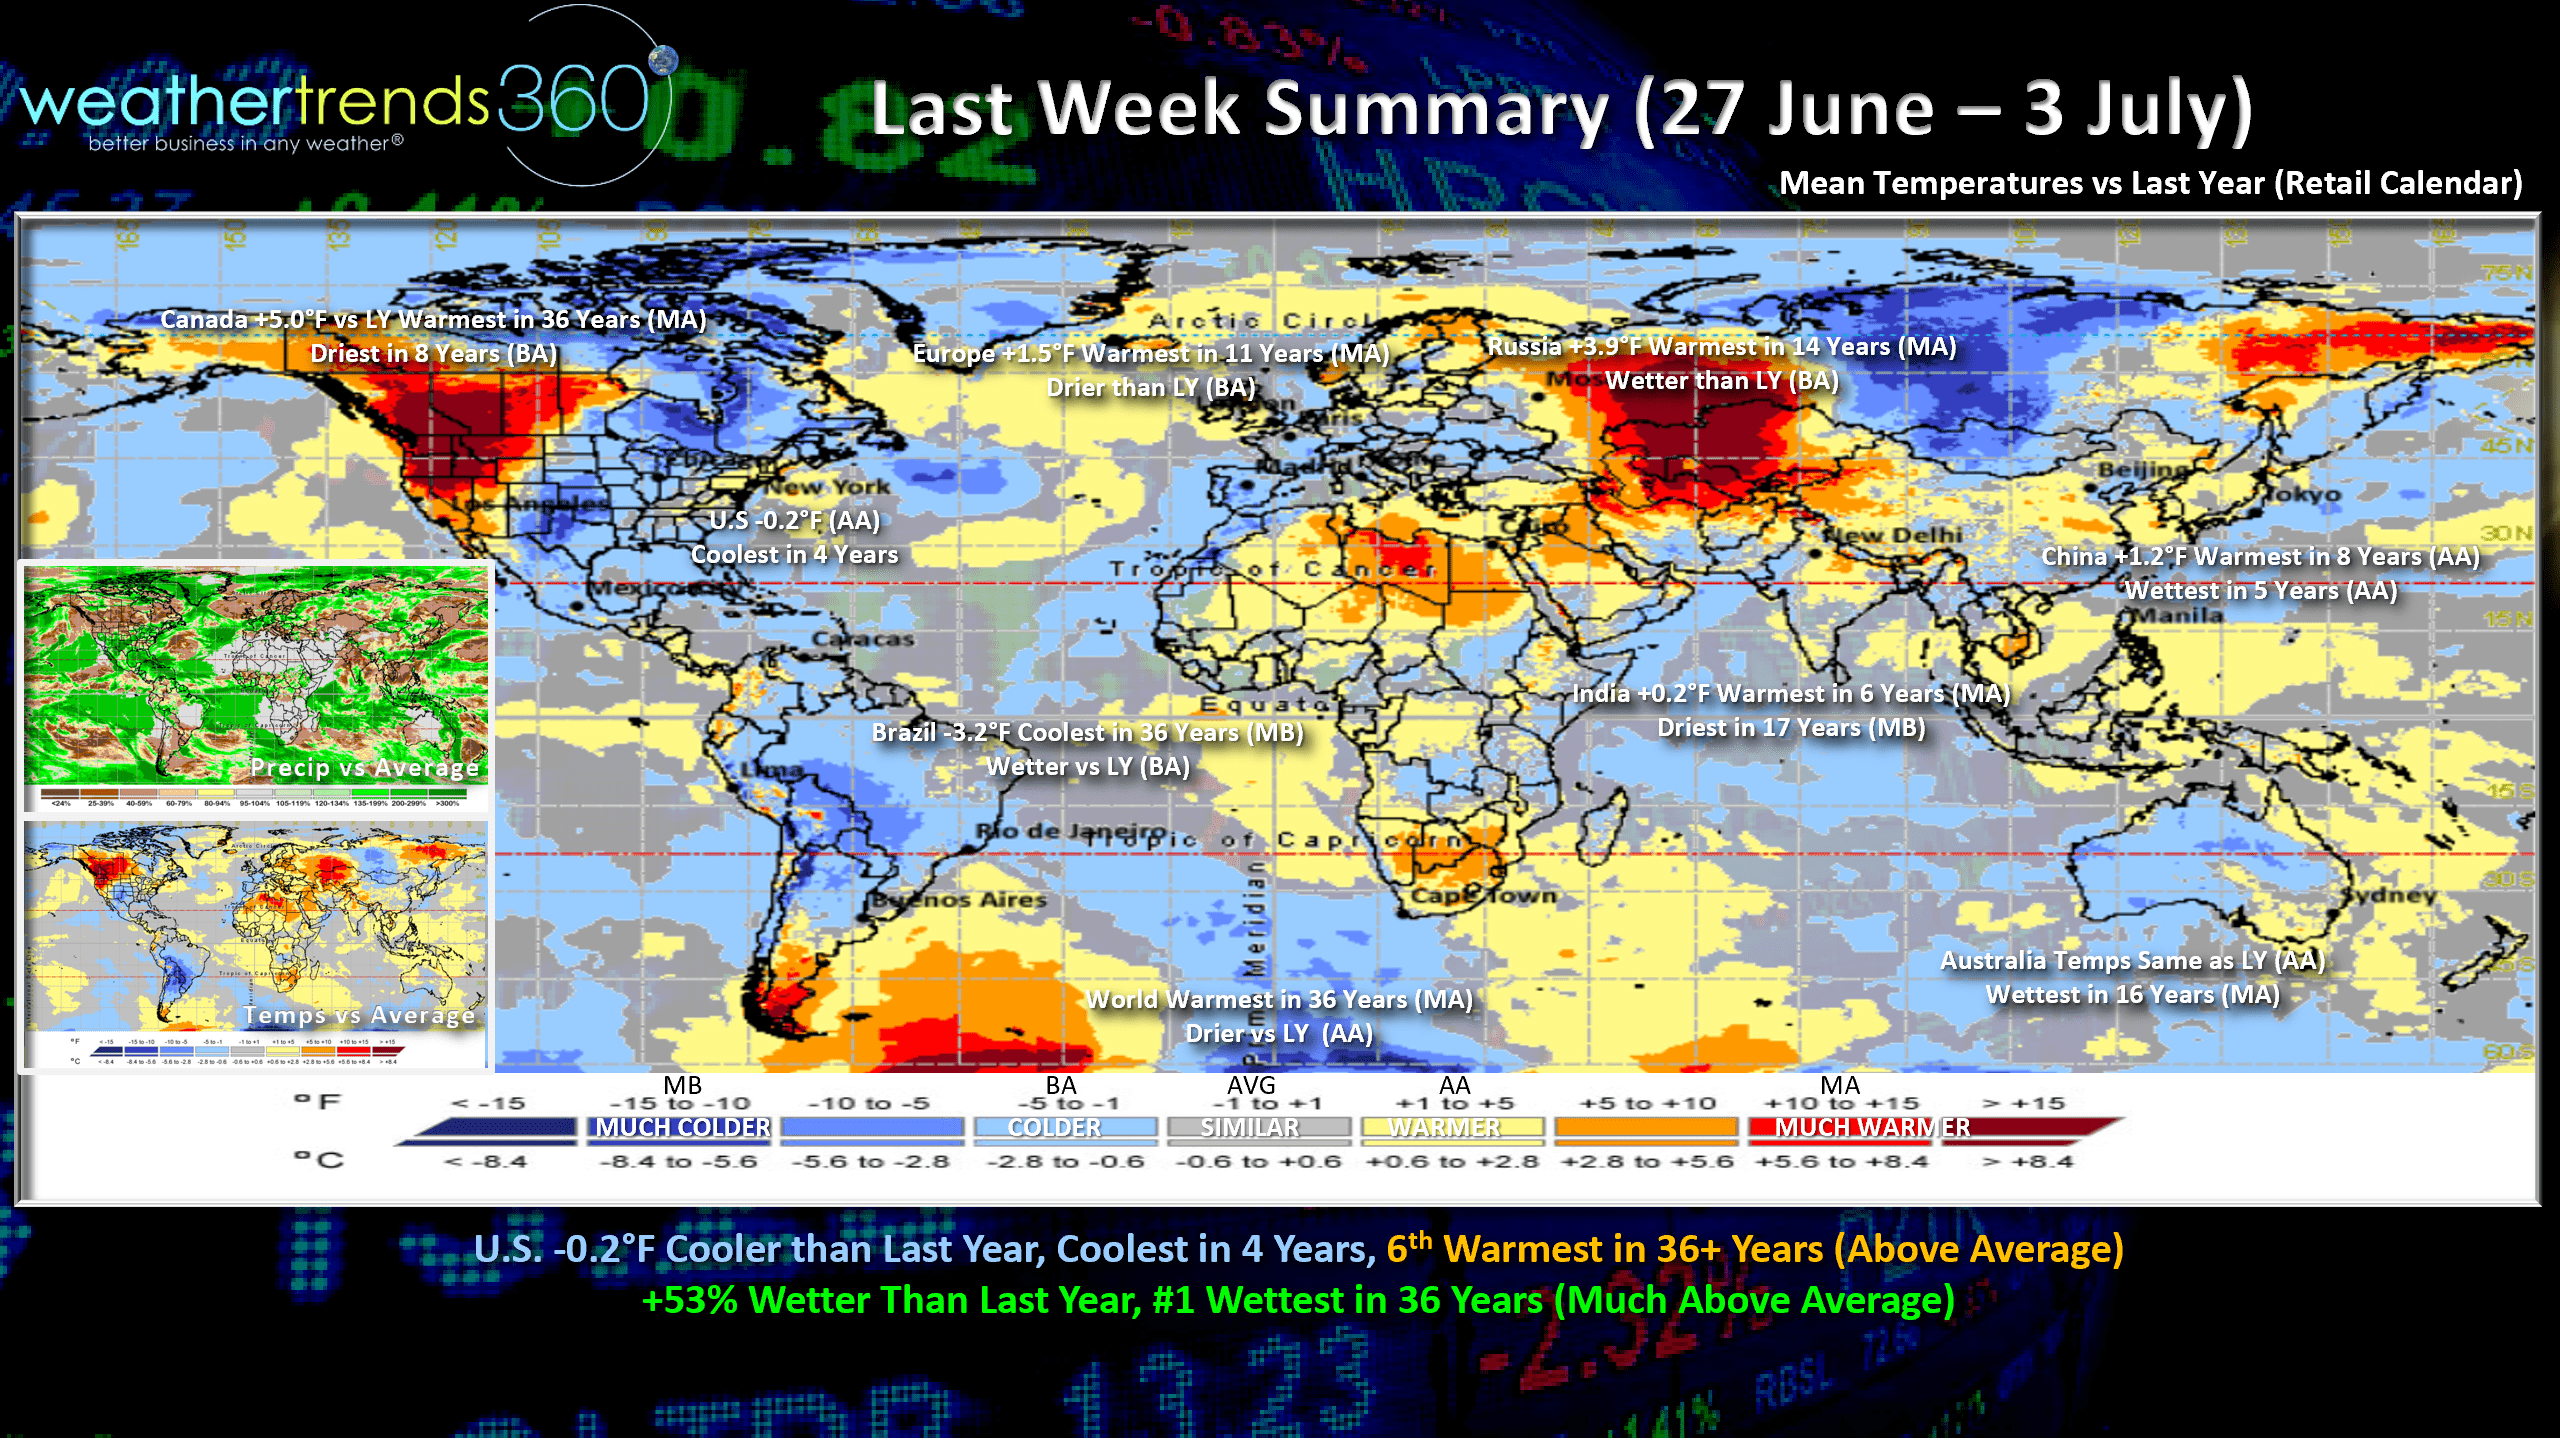
Canada was the hottest in 36 years and driest in 8 years, Russia the warmest in 14 years, Europe warmest in 11 years, China warmest in 8 years, India warmest in 6 years while Brazil was the cooler spot trending coolest in over 36 years.
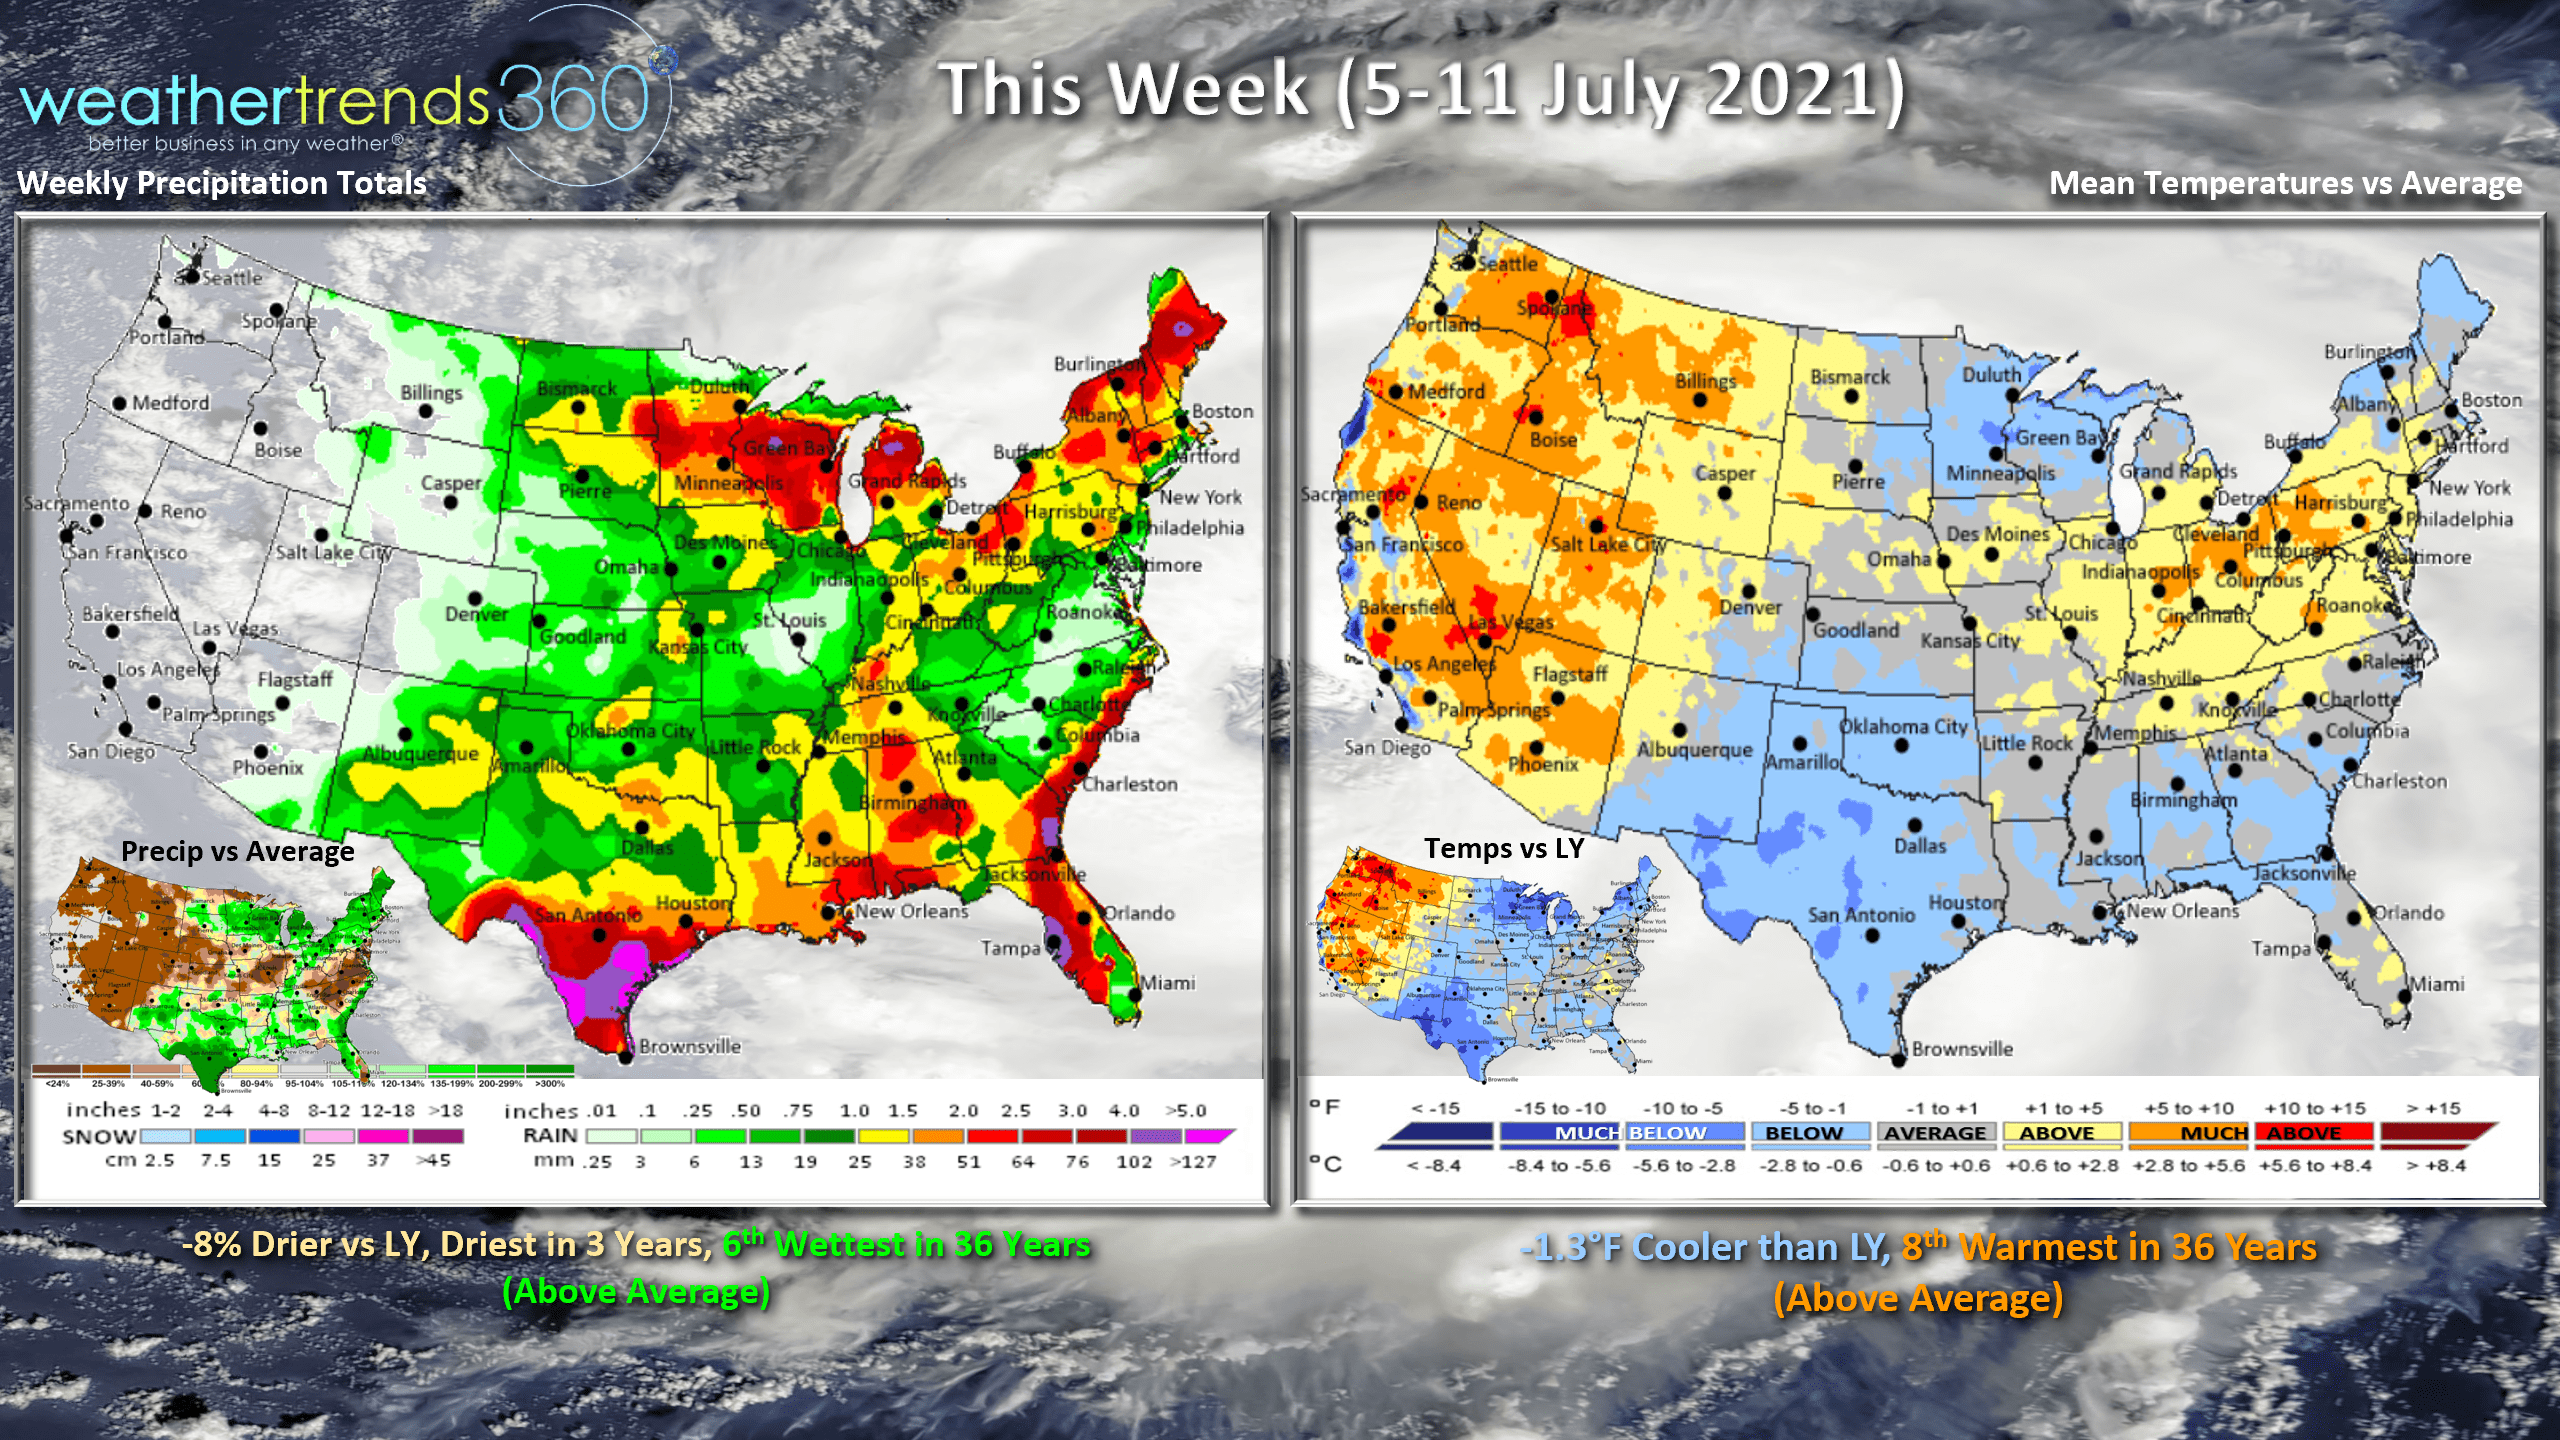
This week (5-11 July) shows the U.S. continuing to trend cooler than last year but still 8th warmest of the past 36 years. Rainfall 8% drier than a year ago and driest in 3 years but still 6th wettest of the past 36 years as Tropical Storm Elsa impacts the Southeast U.S. Texas and parts of the Southwest continue to have much below average temperatures, unusual for sure.
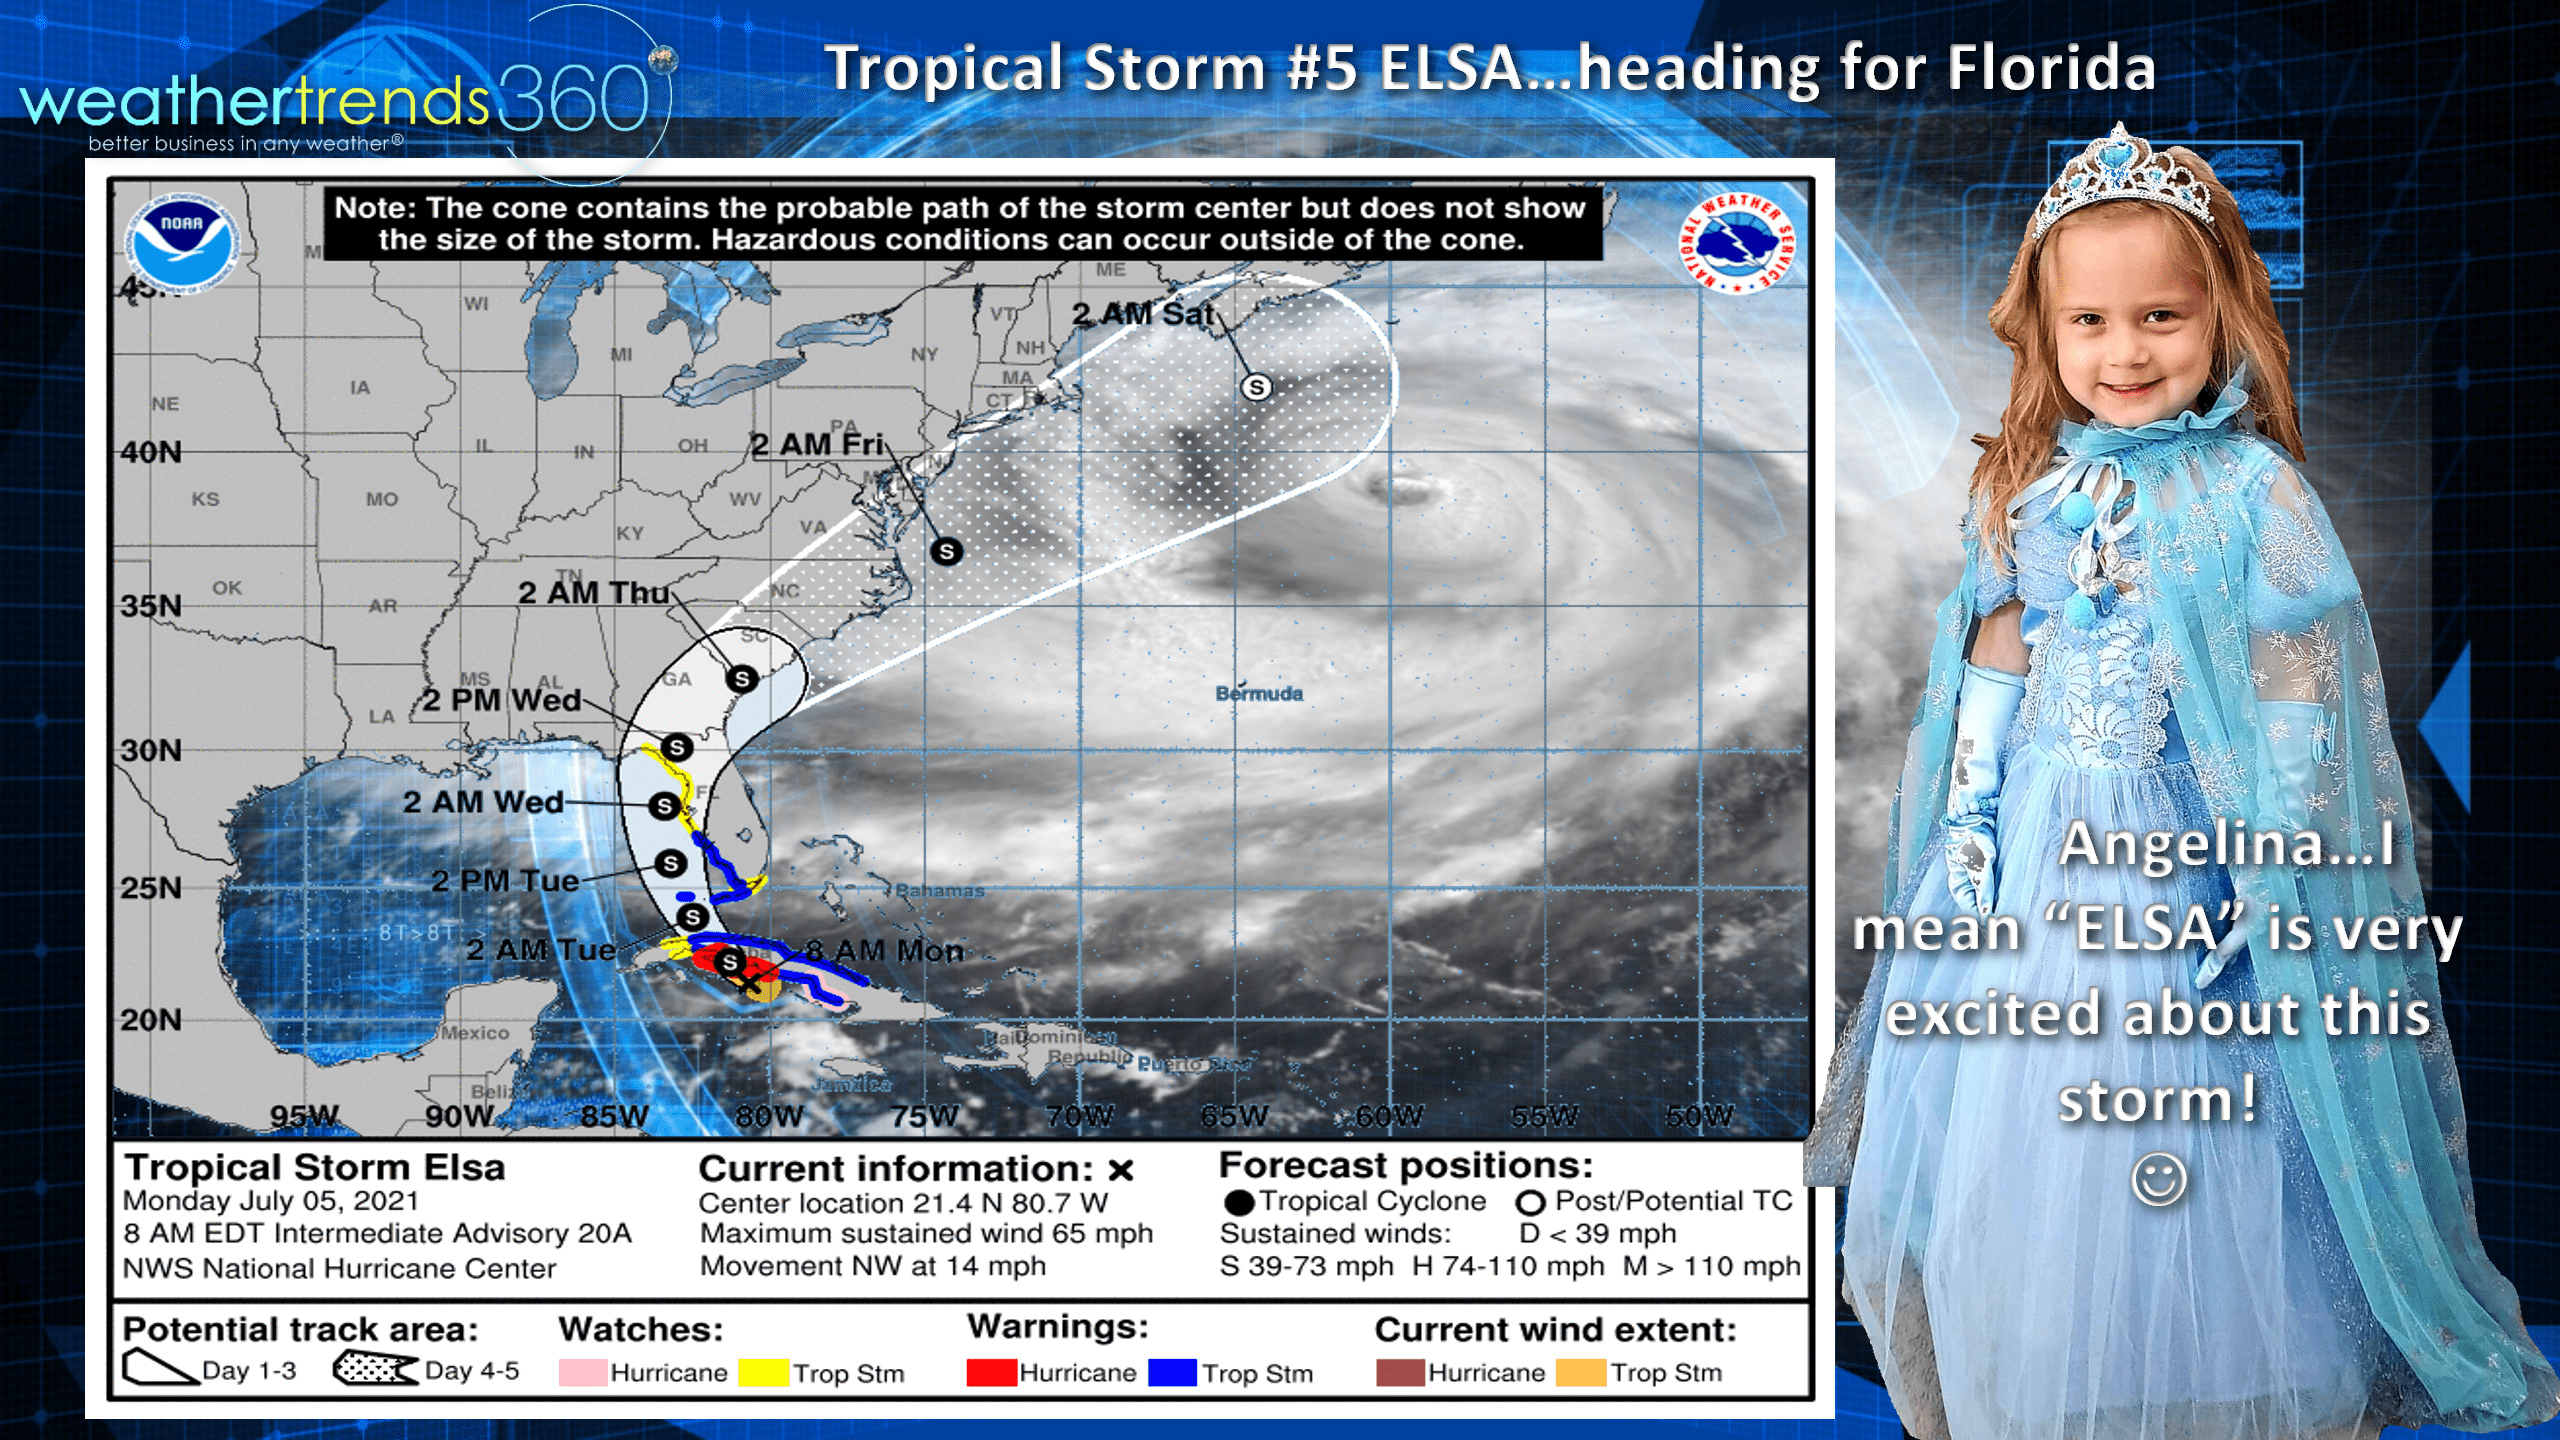
Tropical Storm Elsa briefly became a hurricane over the weekend but now back to a Tropical Storm as it traverses over Cuba on it's way to making landfall late Tuesday - early Wednesday in the Pan Handle of Florida.
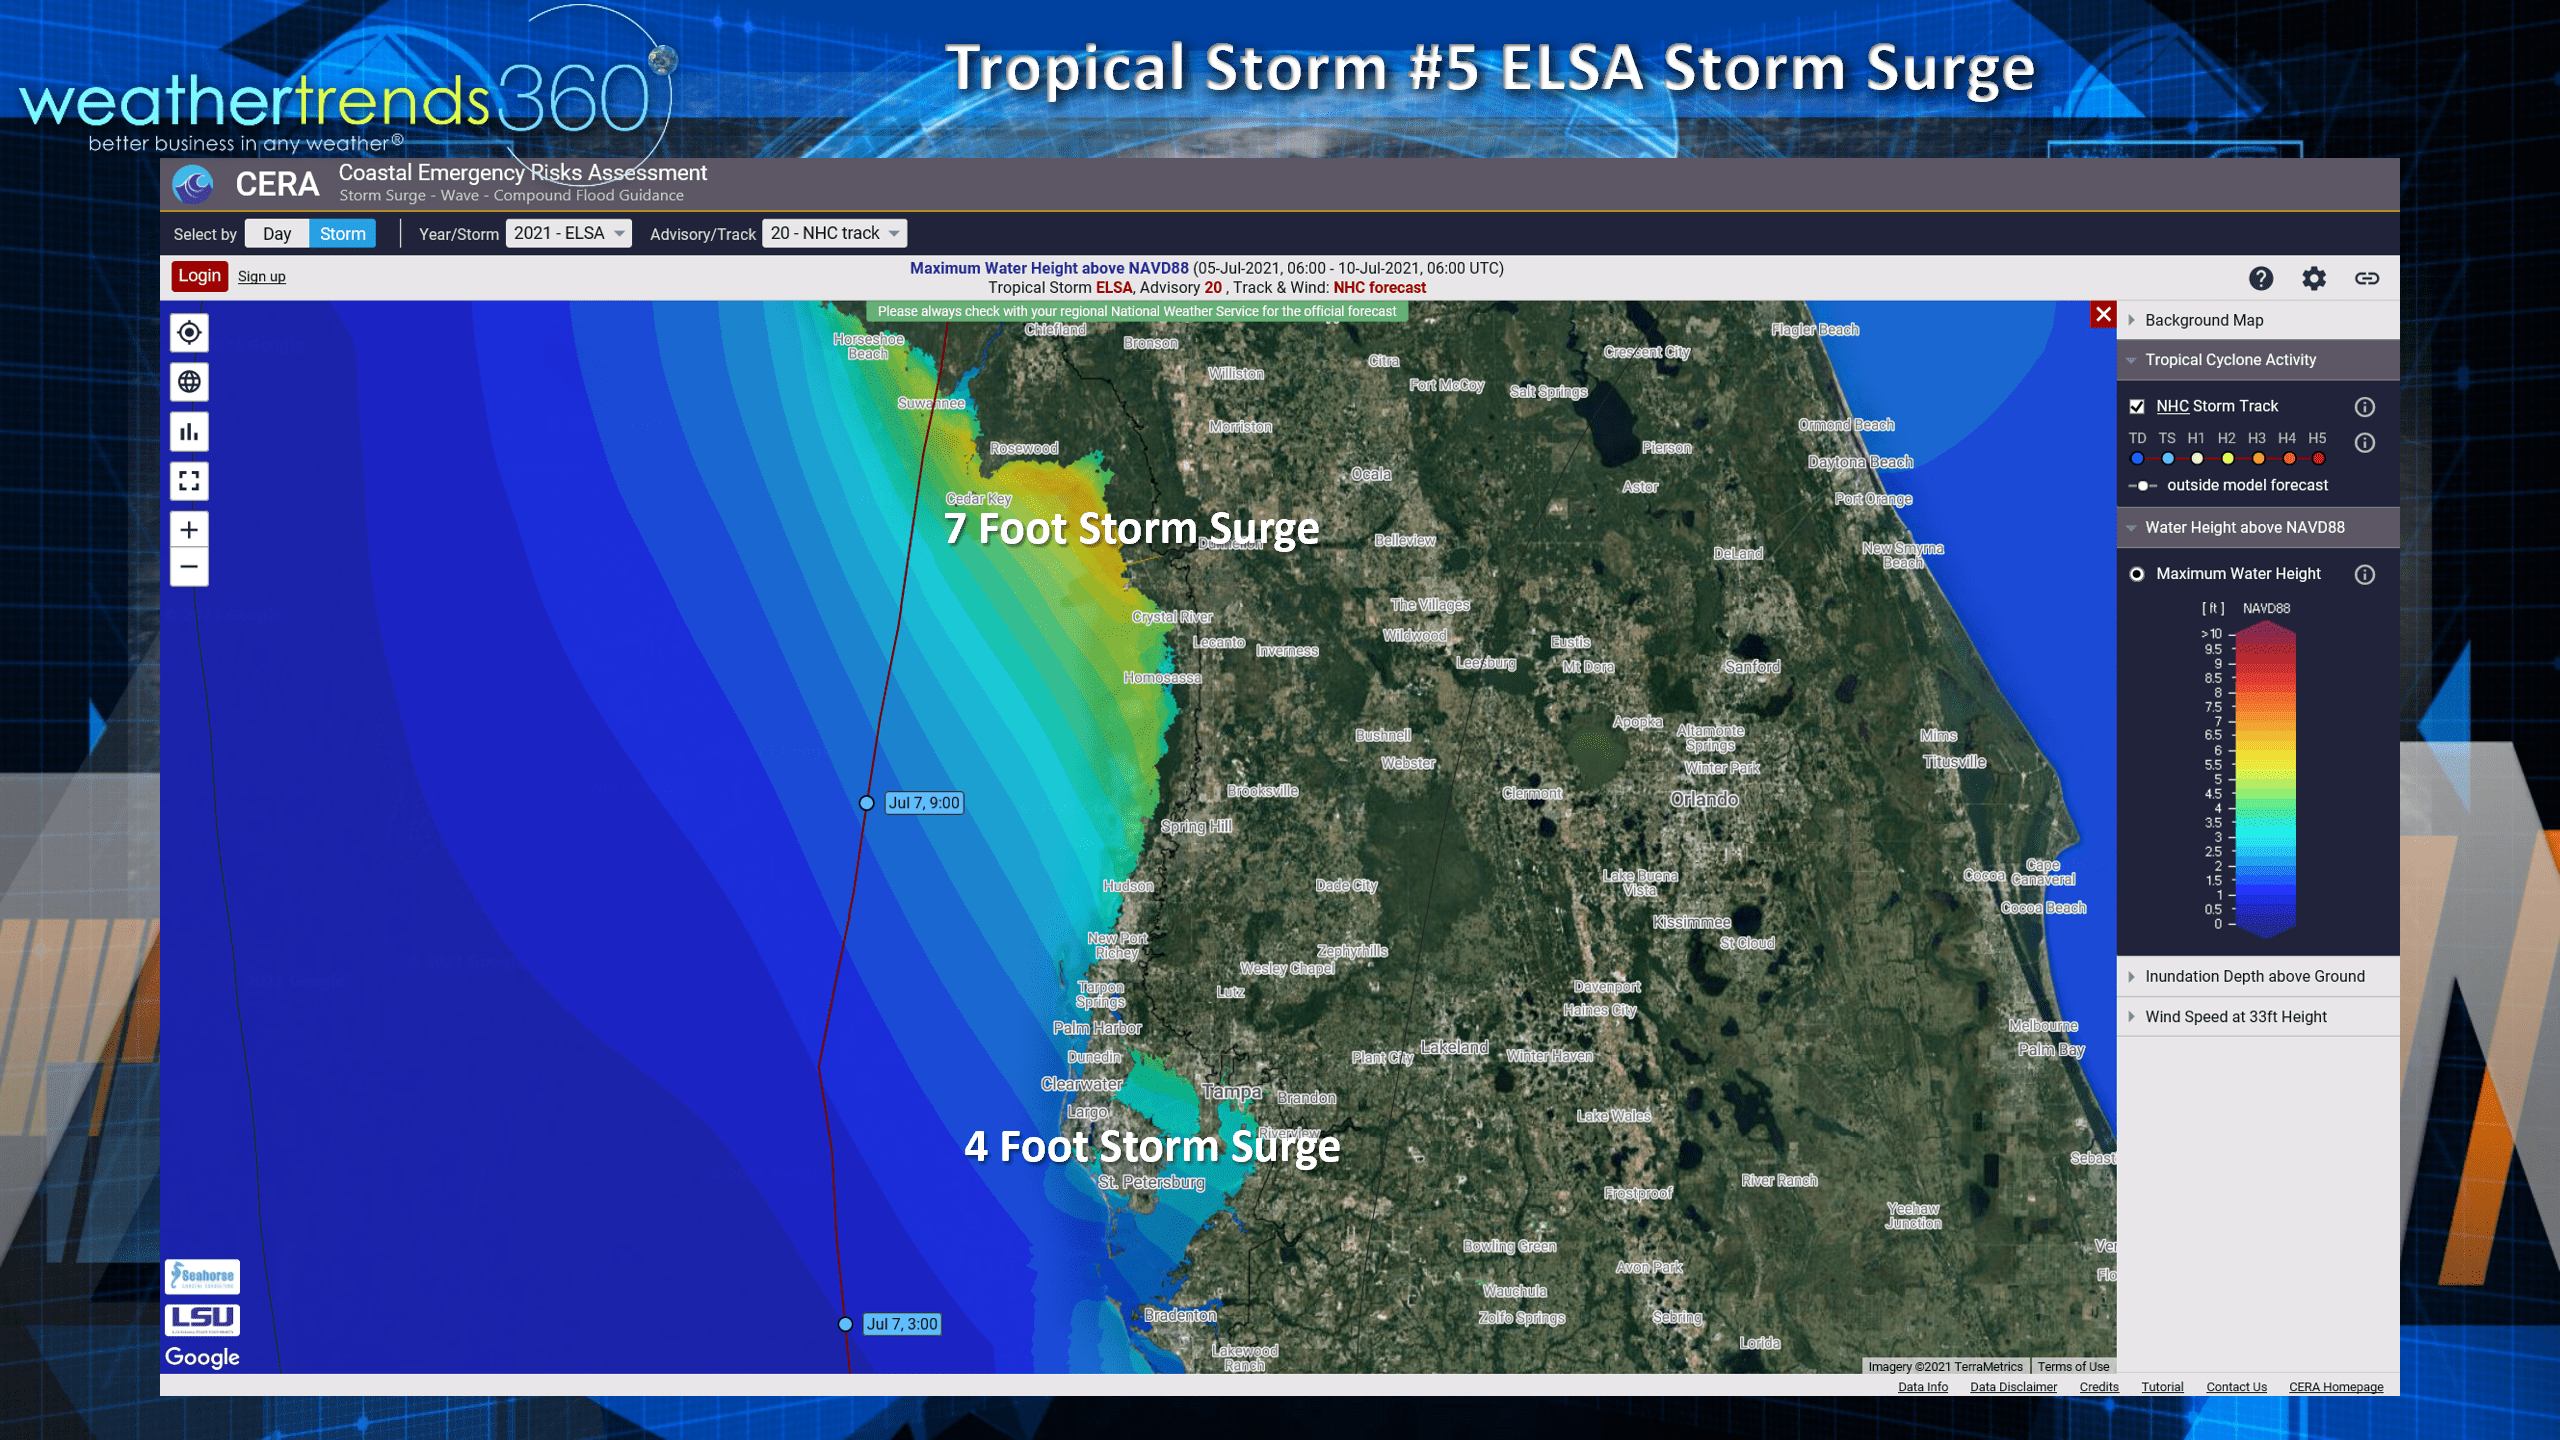
Some storm surge in the Tampa Bay area with a prolonged Southwest wind flow piling up in the bay.
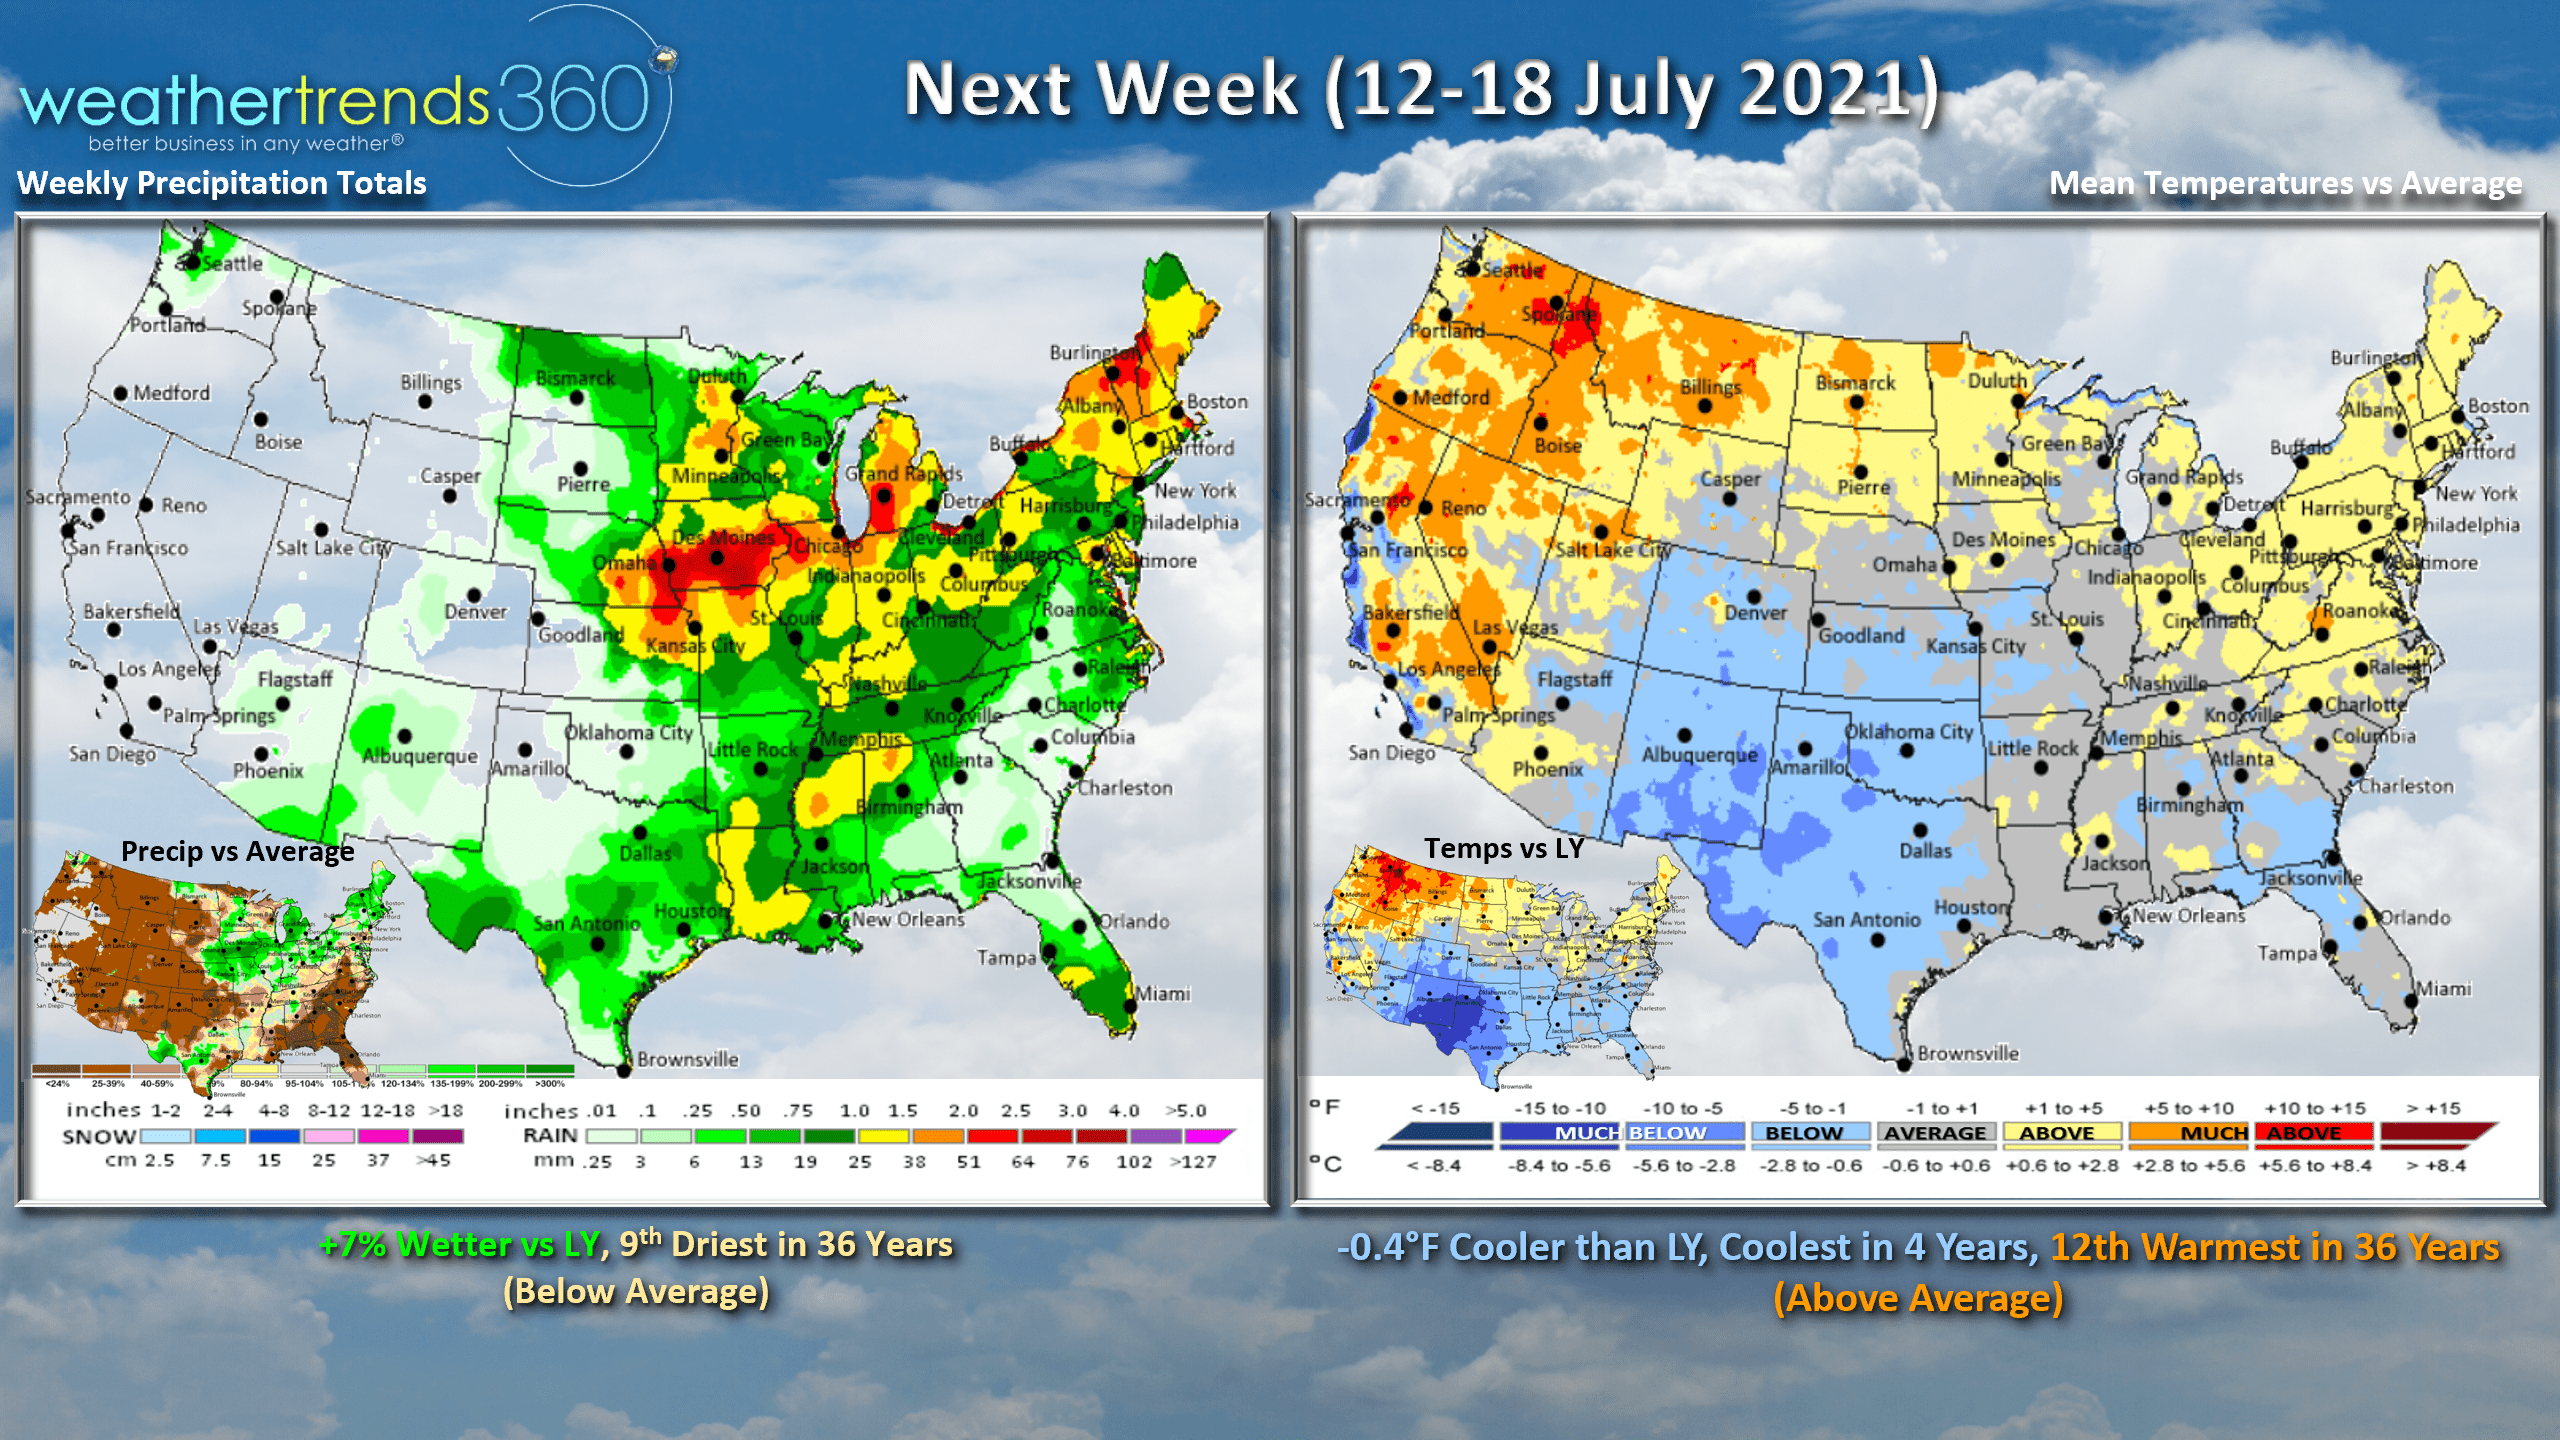
Next week (12-18 July) again trends -0.4F cooler than last year, coolest in 4 years but still 12th warmest of the past 36 years for the U.S. overall. Remains warmer than normal across the North and cooler than normal in the South. Rainfall up 7% vs last year but still 9th driest of the past 36 years.
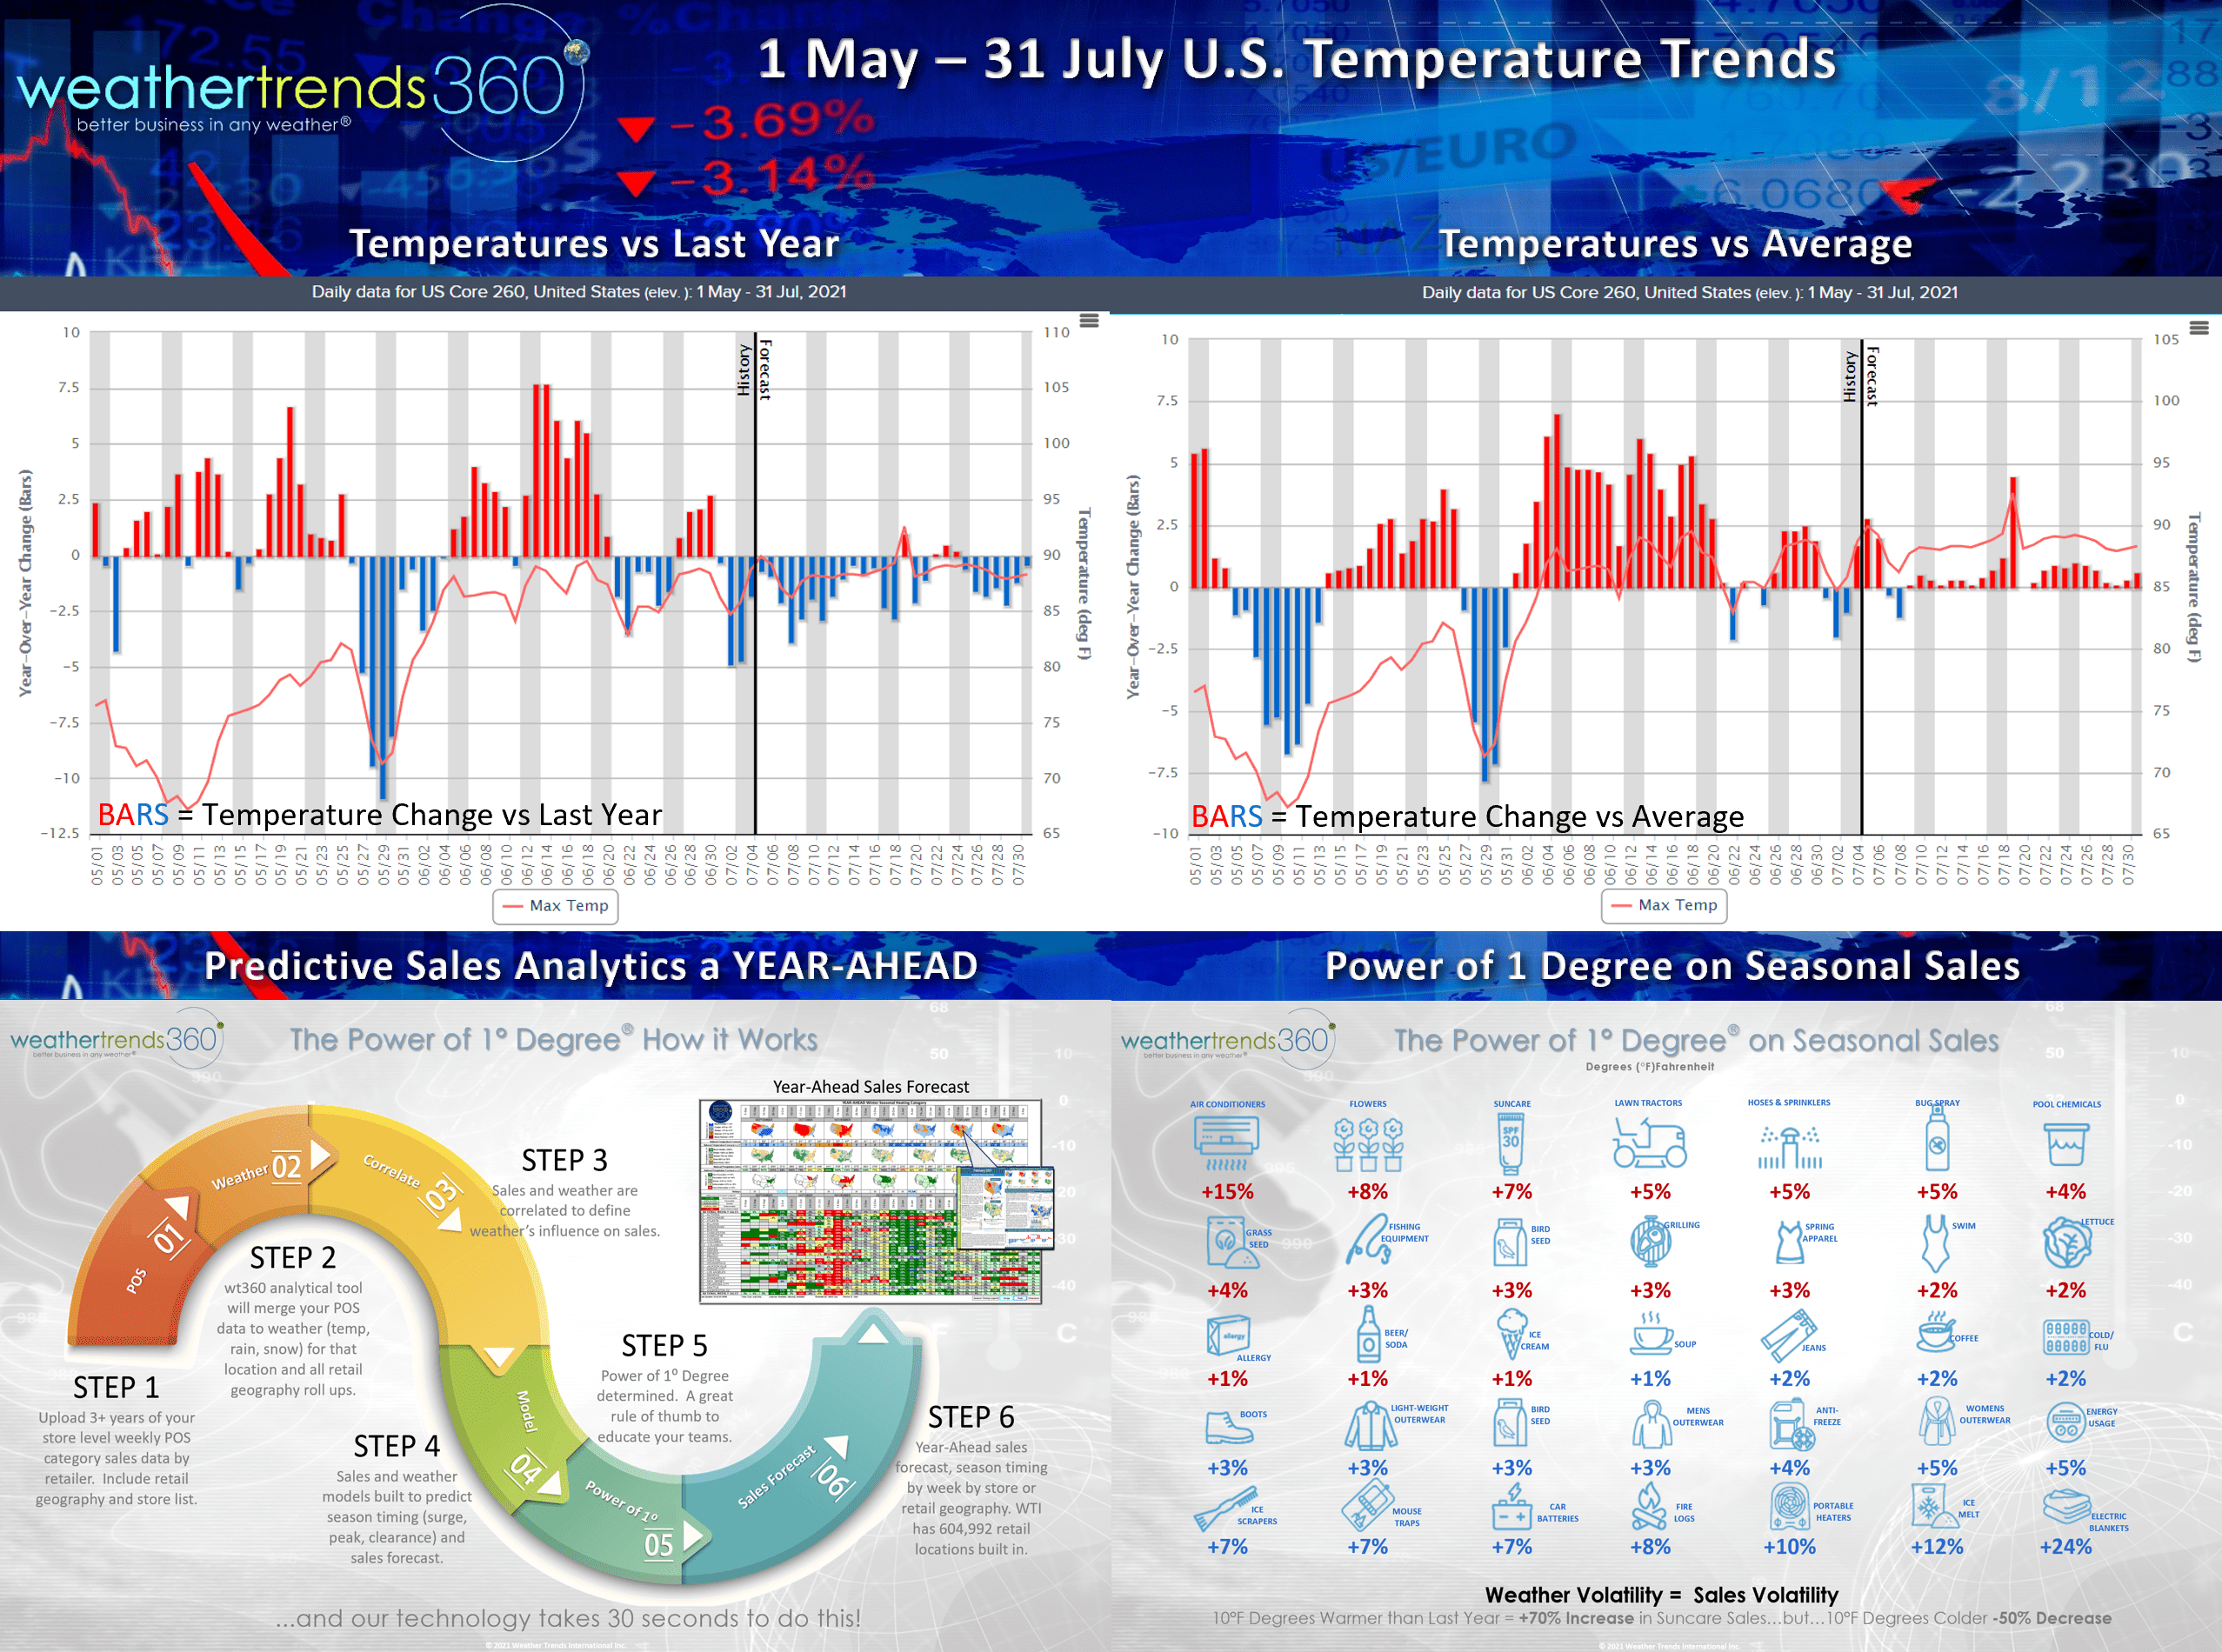
The U.S. temperature trends for the May - July timeframe show the much warmer middle May and June which benefited strong sales for seasonal merchandise. While July has been well above average, the trends are actually cooler than last year which can suppress sales that were exceptionally strong a year ago. WTI's Power of 1 Degree technology quantifies the influence of weather on seasonal sales; as an example, every 1F warmer typically results in a 7% increase in suncare sales, 10F warmer = 70% increase in sales. The weather trends certainly benefited many seasonal items in May and June with some cannibalization of sales here in July.
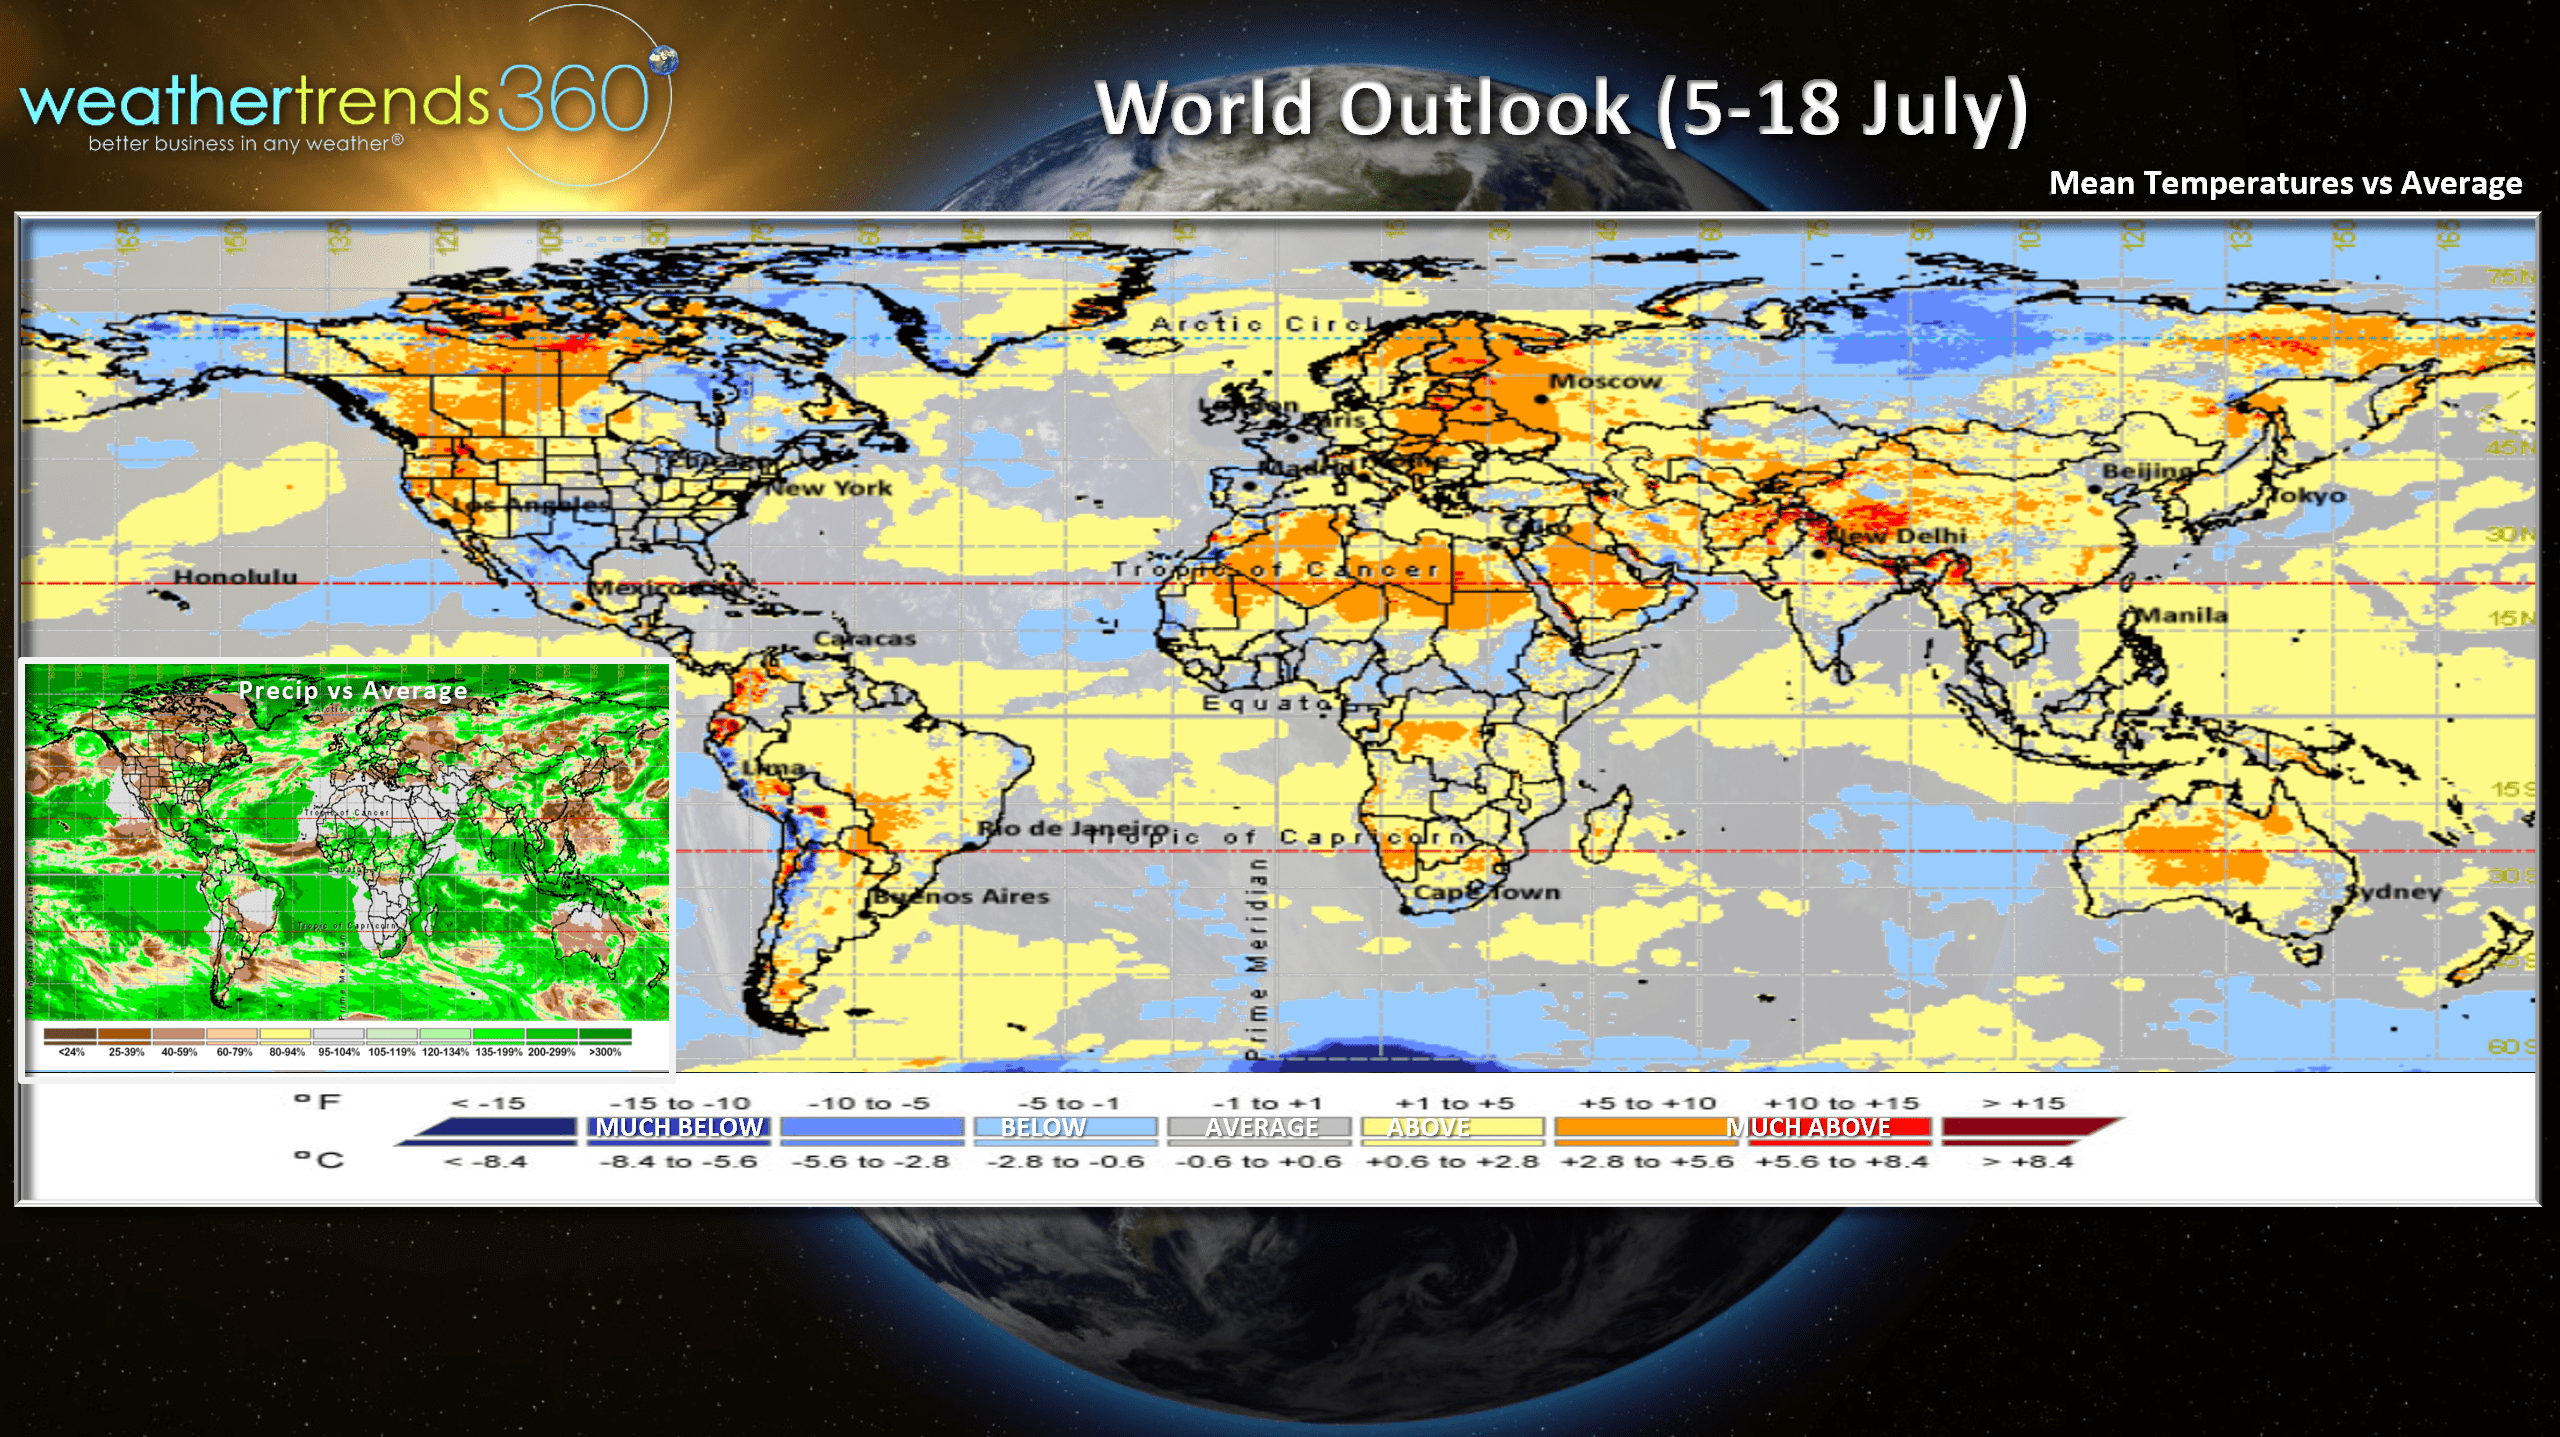
The 2-week World (5-18 July) outlook shows continued hot trends in the U.S. and Canada, Eastern Europe and SW Russia, China, India and warming in Brazil.
We hope you have a great week and don't forget to follow us on social media for frequent updates:Facebook, Twitter, YouTube, Pinterest and Linkedin
- Captain Kirk out.