Captain's Log Star Date 7 Oct 2019 Monday
Captain's Log
Happy Monday! :)
We finally have a tad cooler week nationally than last year which will help some early Fall seasonal category sales. While this week trends cooler YOY, there aren't going to be very many until we get to Christmas week so the excess inventory is likely to increase forcing steeper markdowns as we go through Fall. Good news by Christmas. CLICK ON IMAGES FOR A LARGER VIEW.
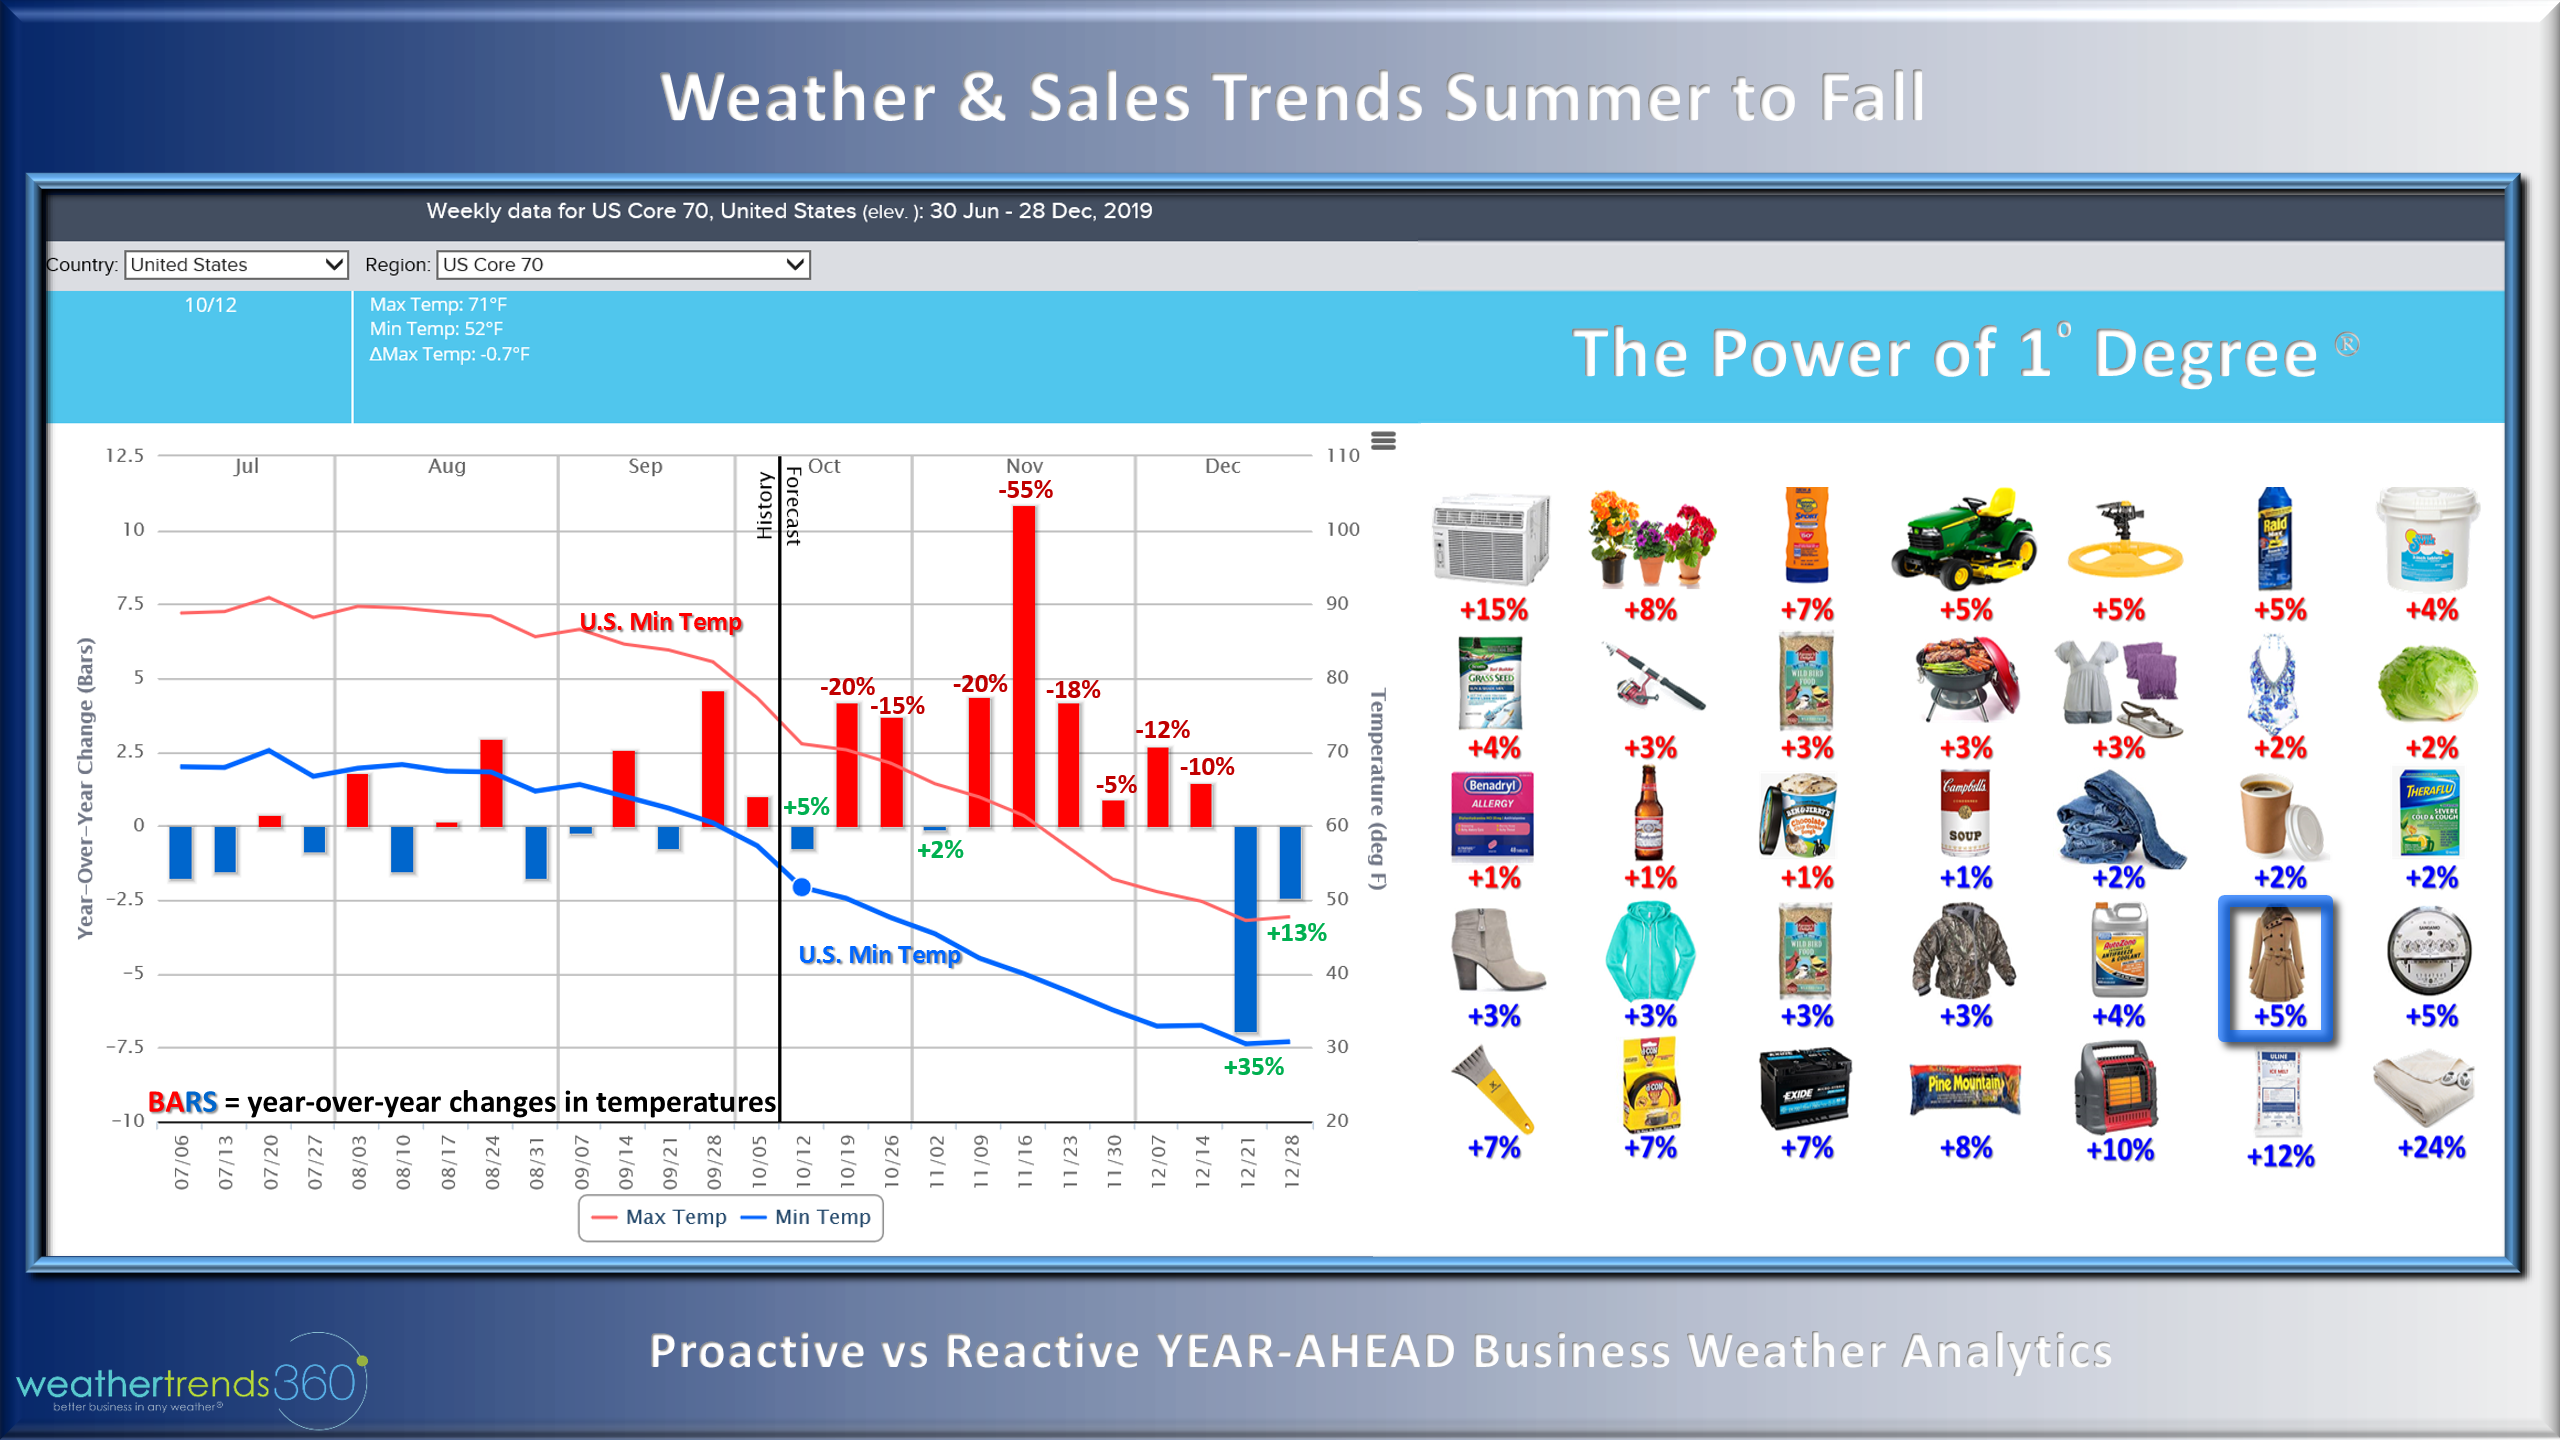
We call our technology The Power of 1 Degree to predict sales by week by store every mile on Earth. In this coat example, every 1F colder YOY brings a 5% increase in coat sales. Obviously there are difference between lite weight coats vs heavy weight coasts vs fleece and sweaters, etc. It's going to be a challenging Fall coming off last year's coldest/snowiest Fall in 16 years for the U.S. overall.
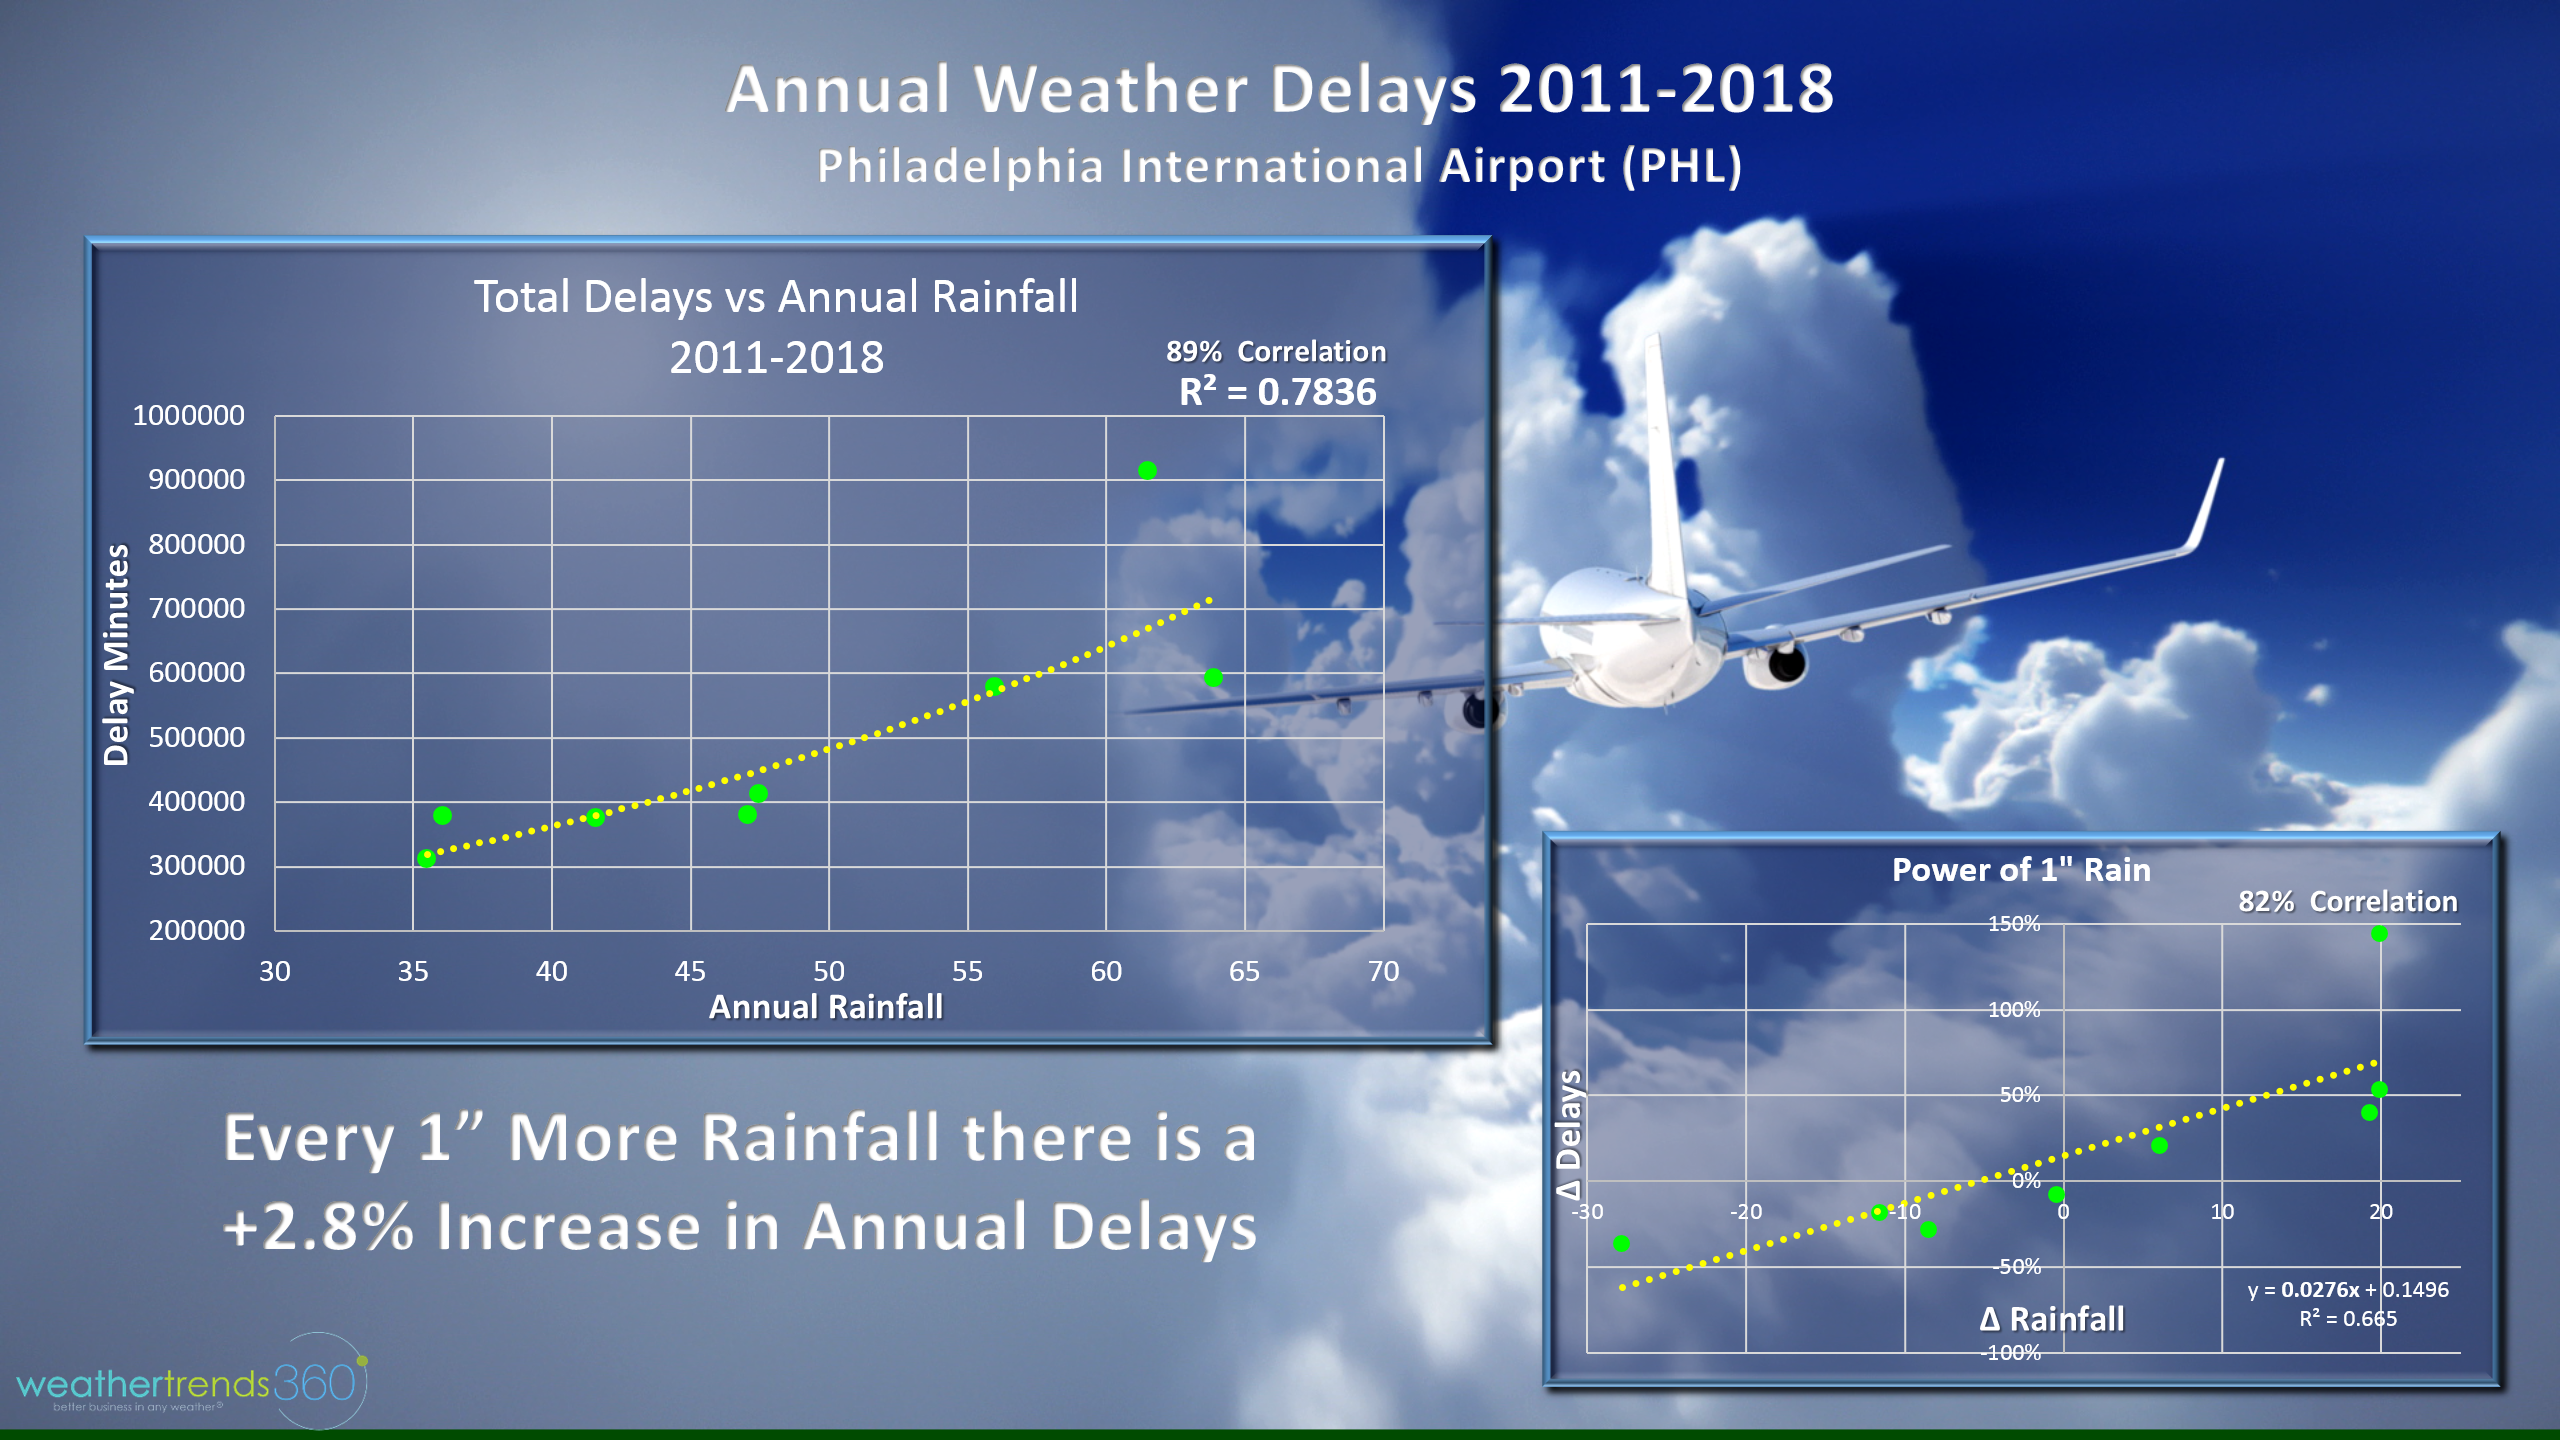
We love to turn our technology on different data sets so we thought we'd look at airline flight delays as we gear up for the big holiday travel season ahead. The correlation between rainfall and flight delays is pretty amazing but not all that surprising. At Philadelphia International Airport as an example, every 1" more rainfall translates to a 2.8% increase in flight delays, 10"...28% increase.
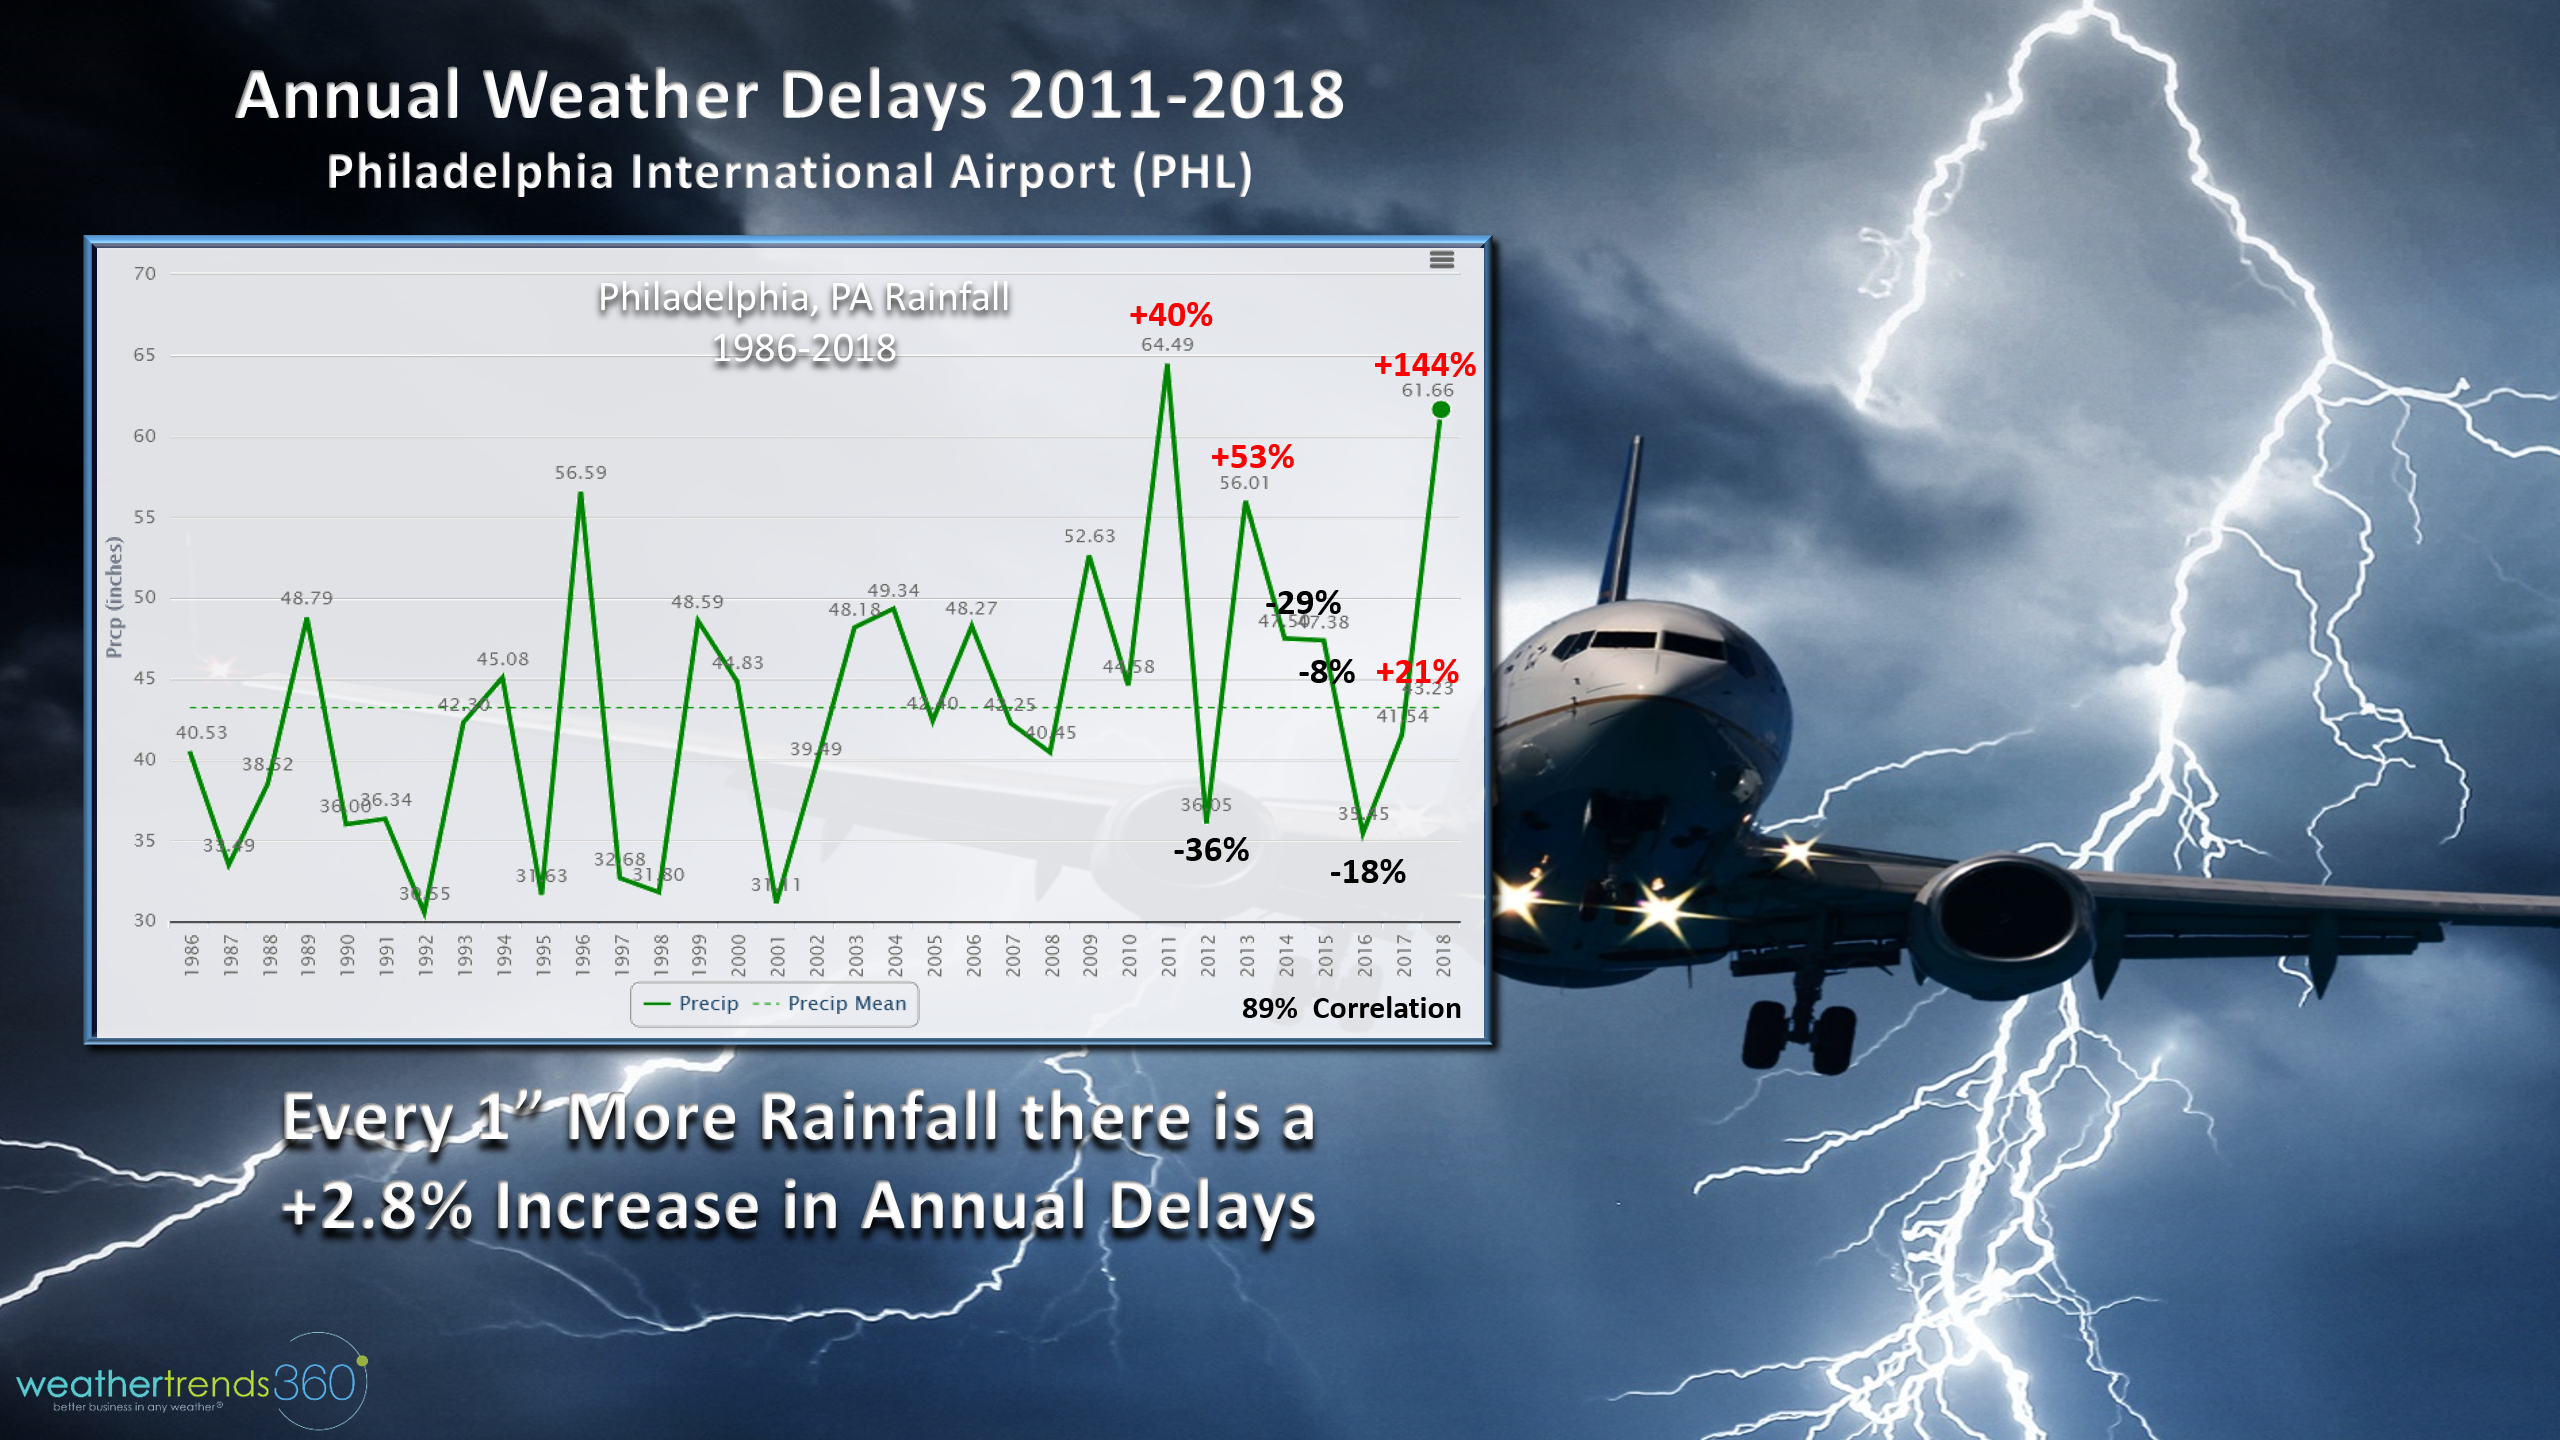
So goes the annual rainfall trends, so goes flight delays. The good news is we are forecasting a very dry year in 2020 so a bright spot for the airlines in the year ahead.
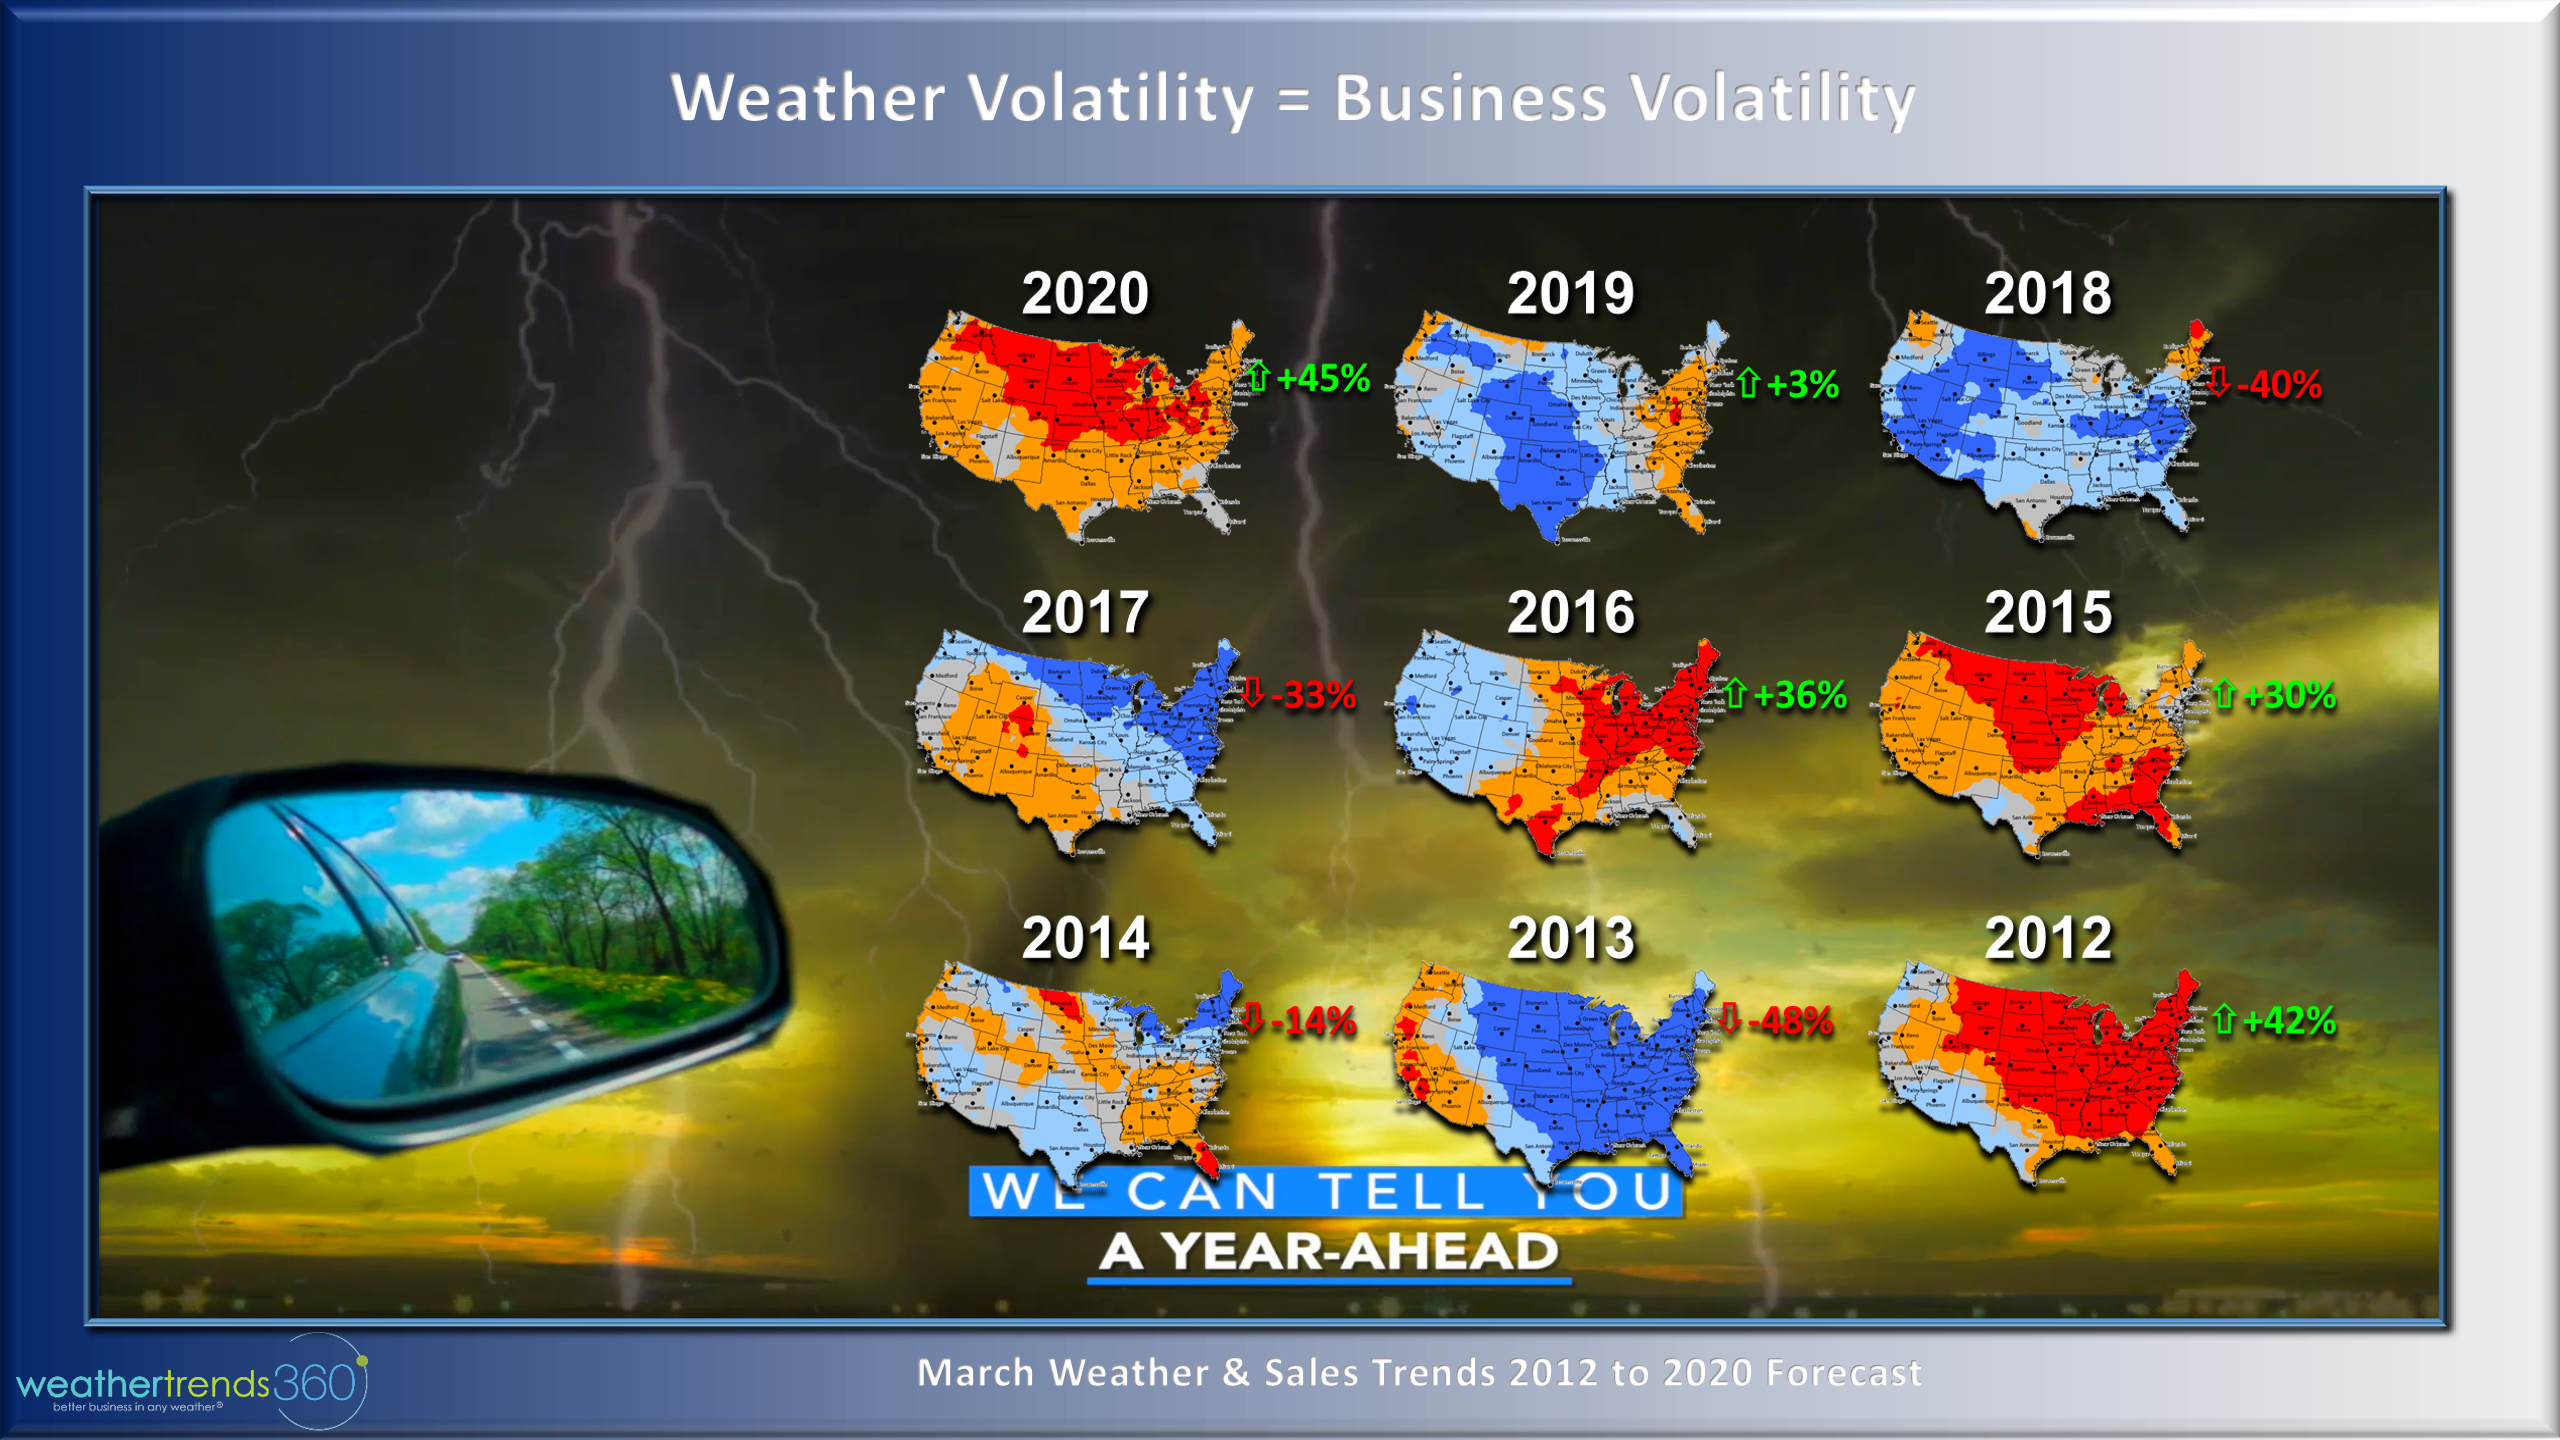 Most companies plan their business of last year's sales which has last year's weather baked into it. So it's important to have a more accurate view of year-ahead weather and the only way to do that is with a ton of statistics and a lot of climate cycles. Meteorology, Physics and Analog methodologies just aren't reliable enough beyond a few weeks. Weather is never the same YOY and March 2020 as an example shows a golden opportunity for retailers and seasonal manufacturers more like 2015, probably not as good as 2012.
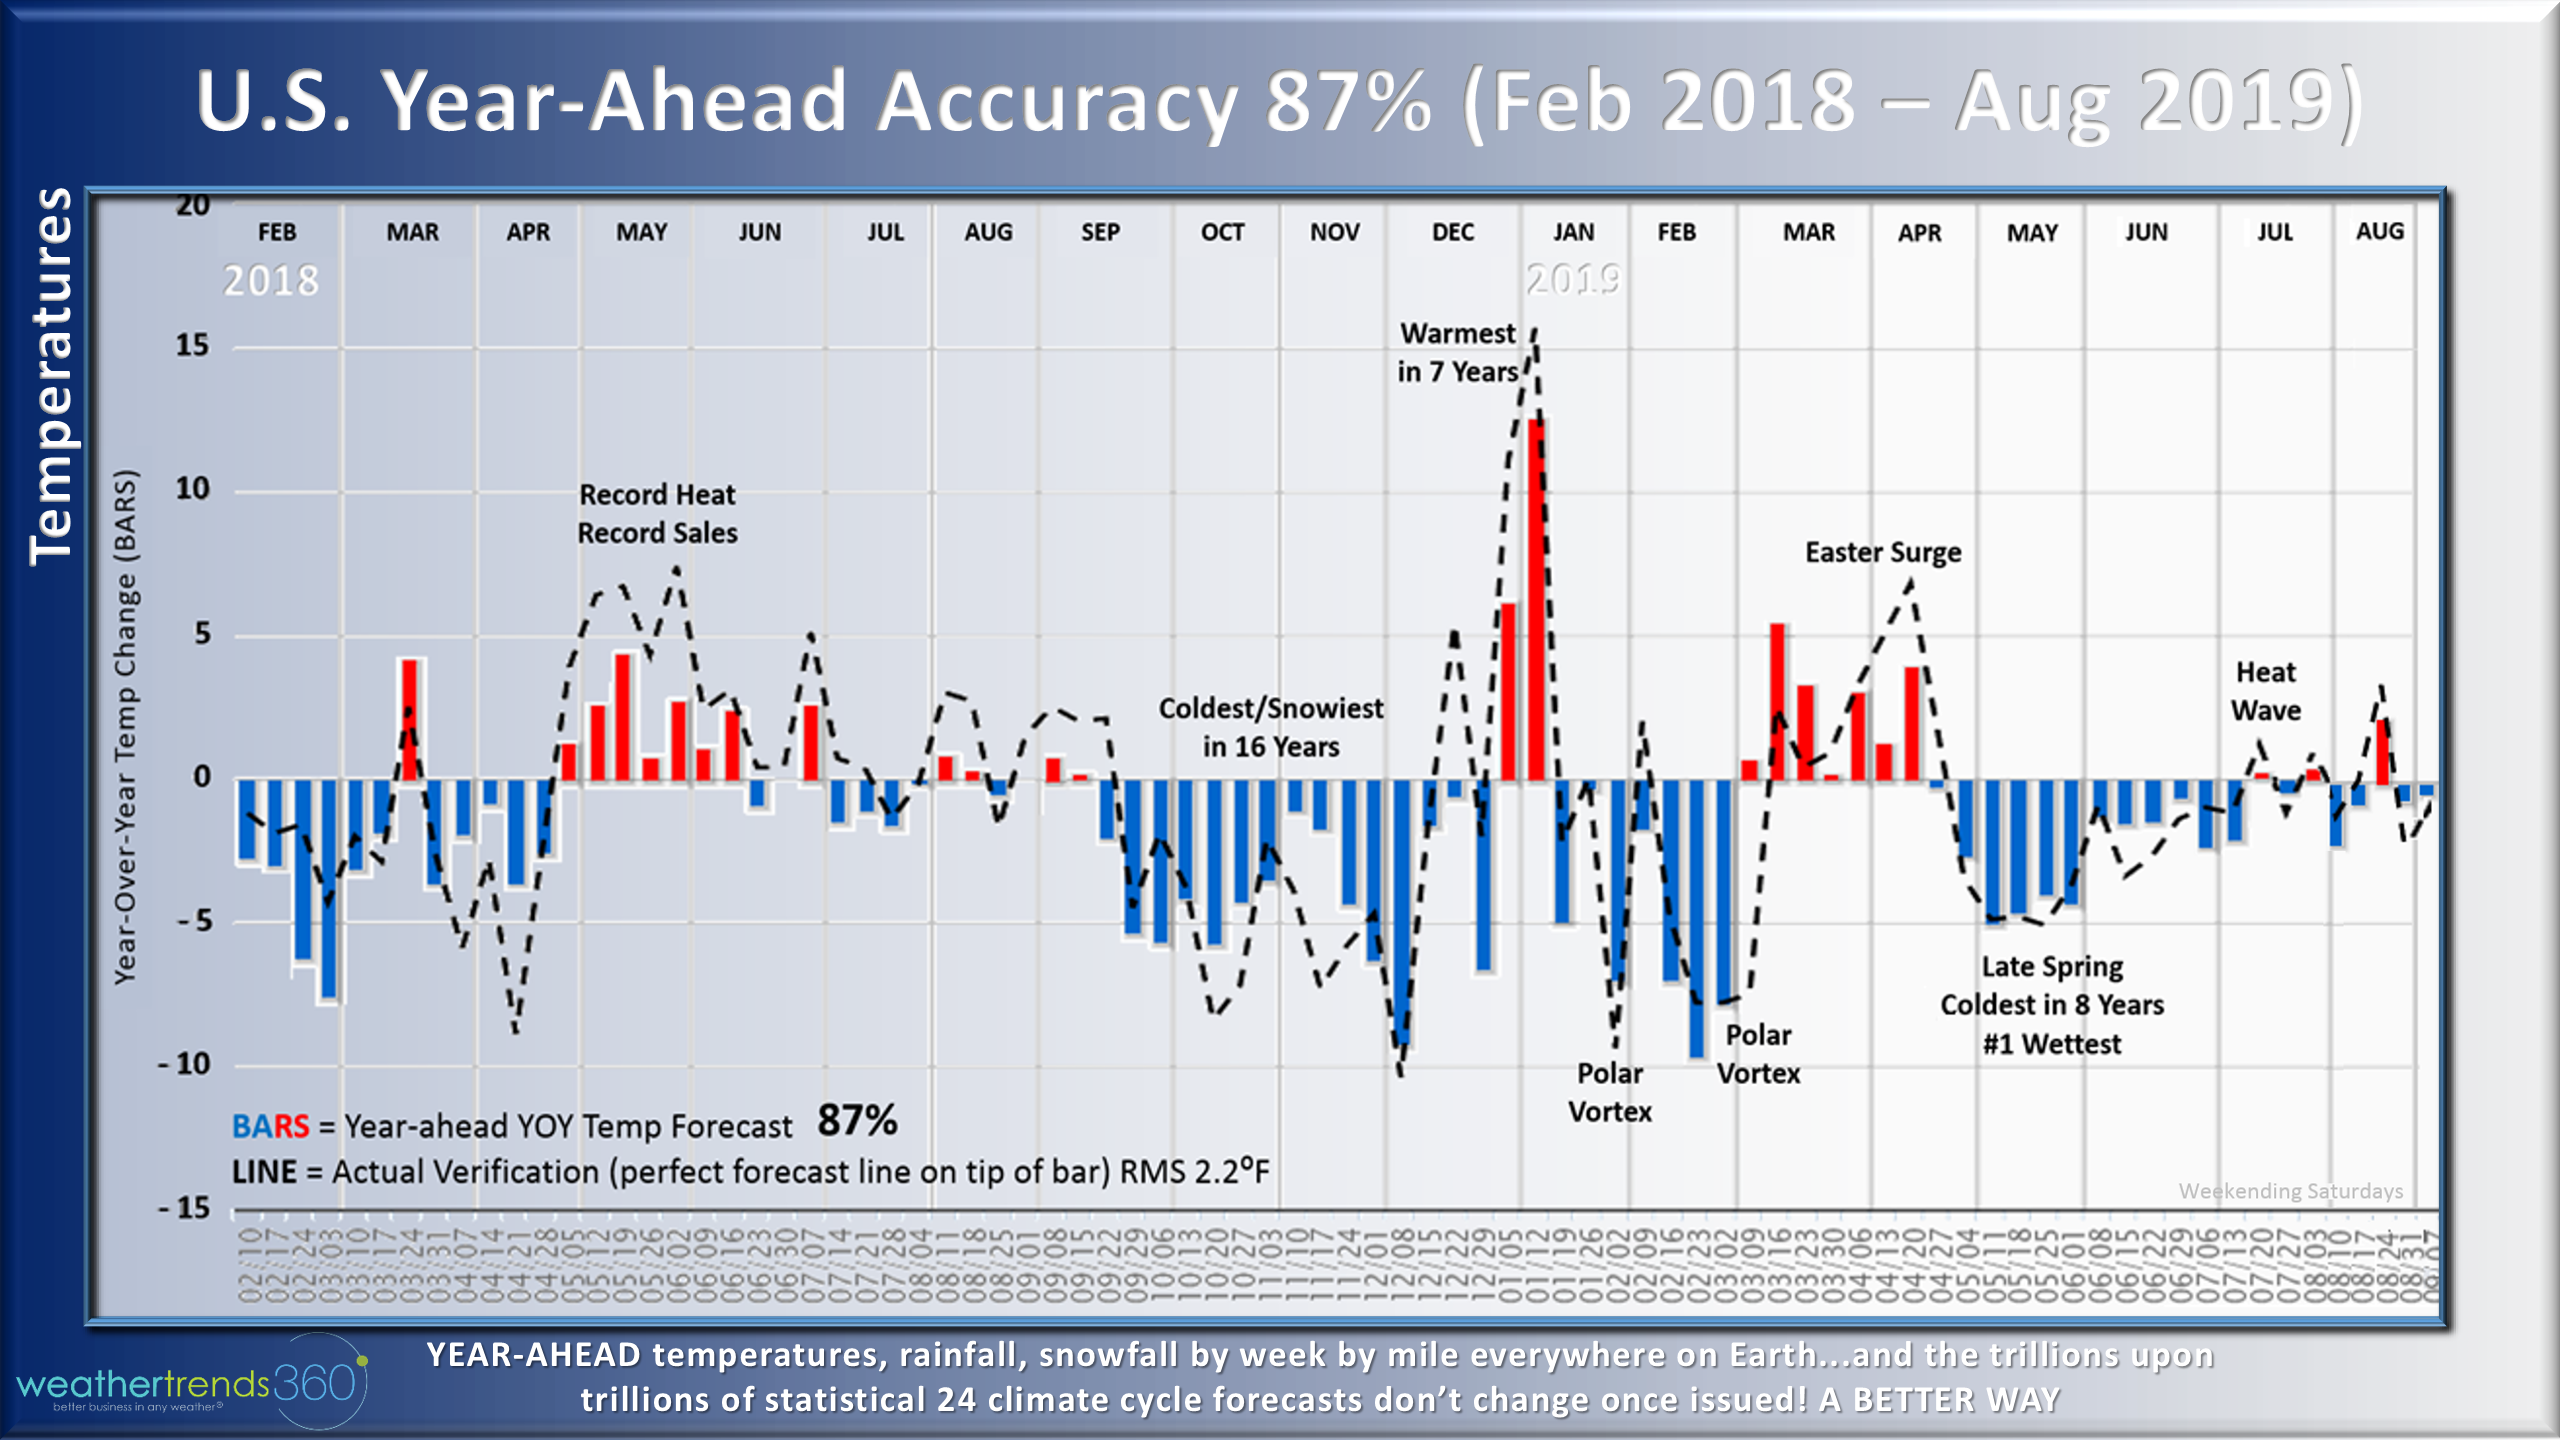
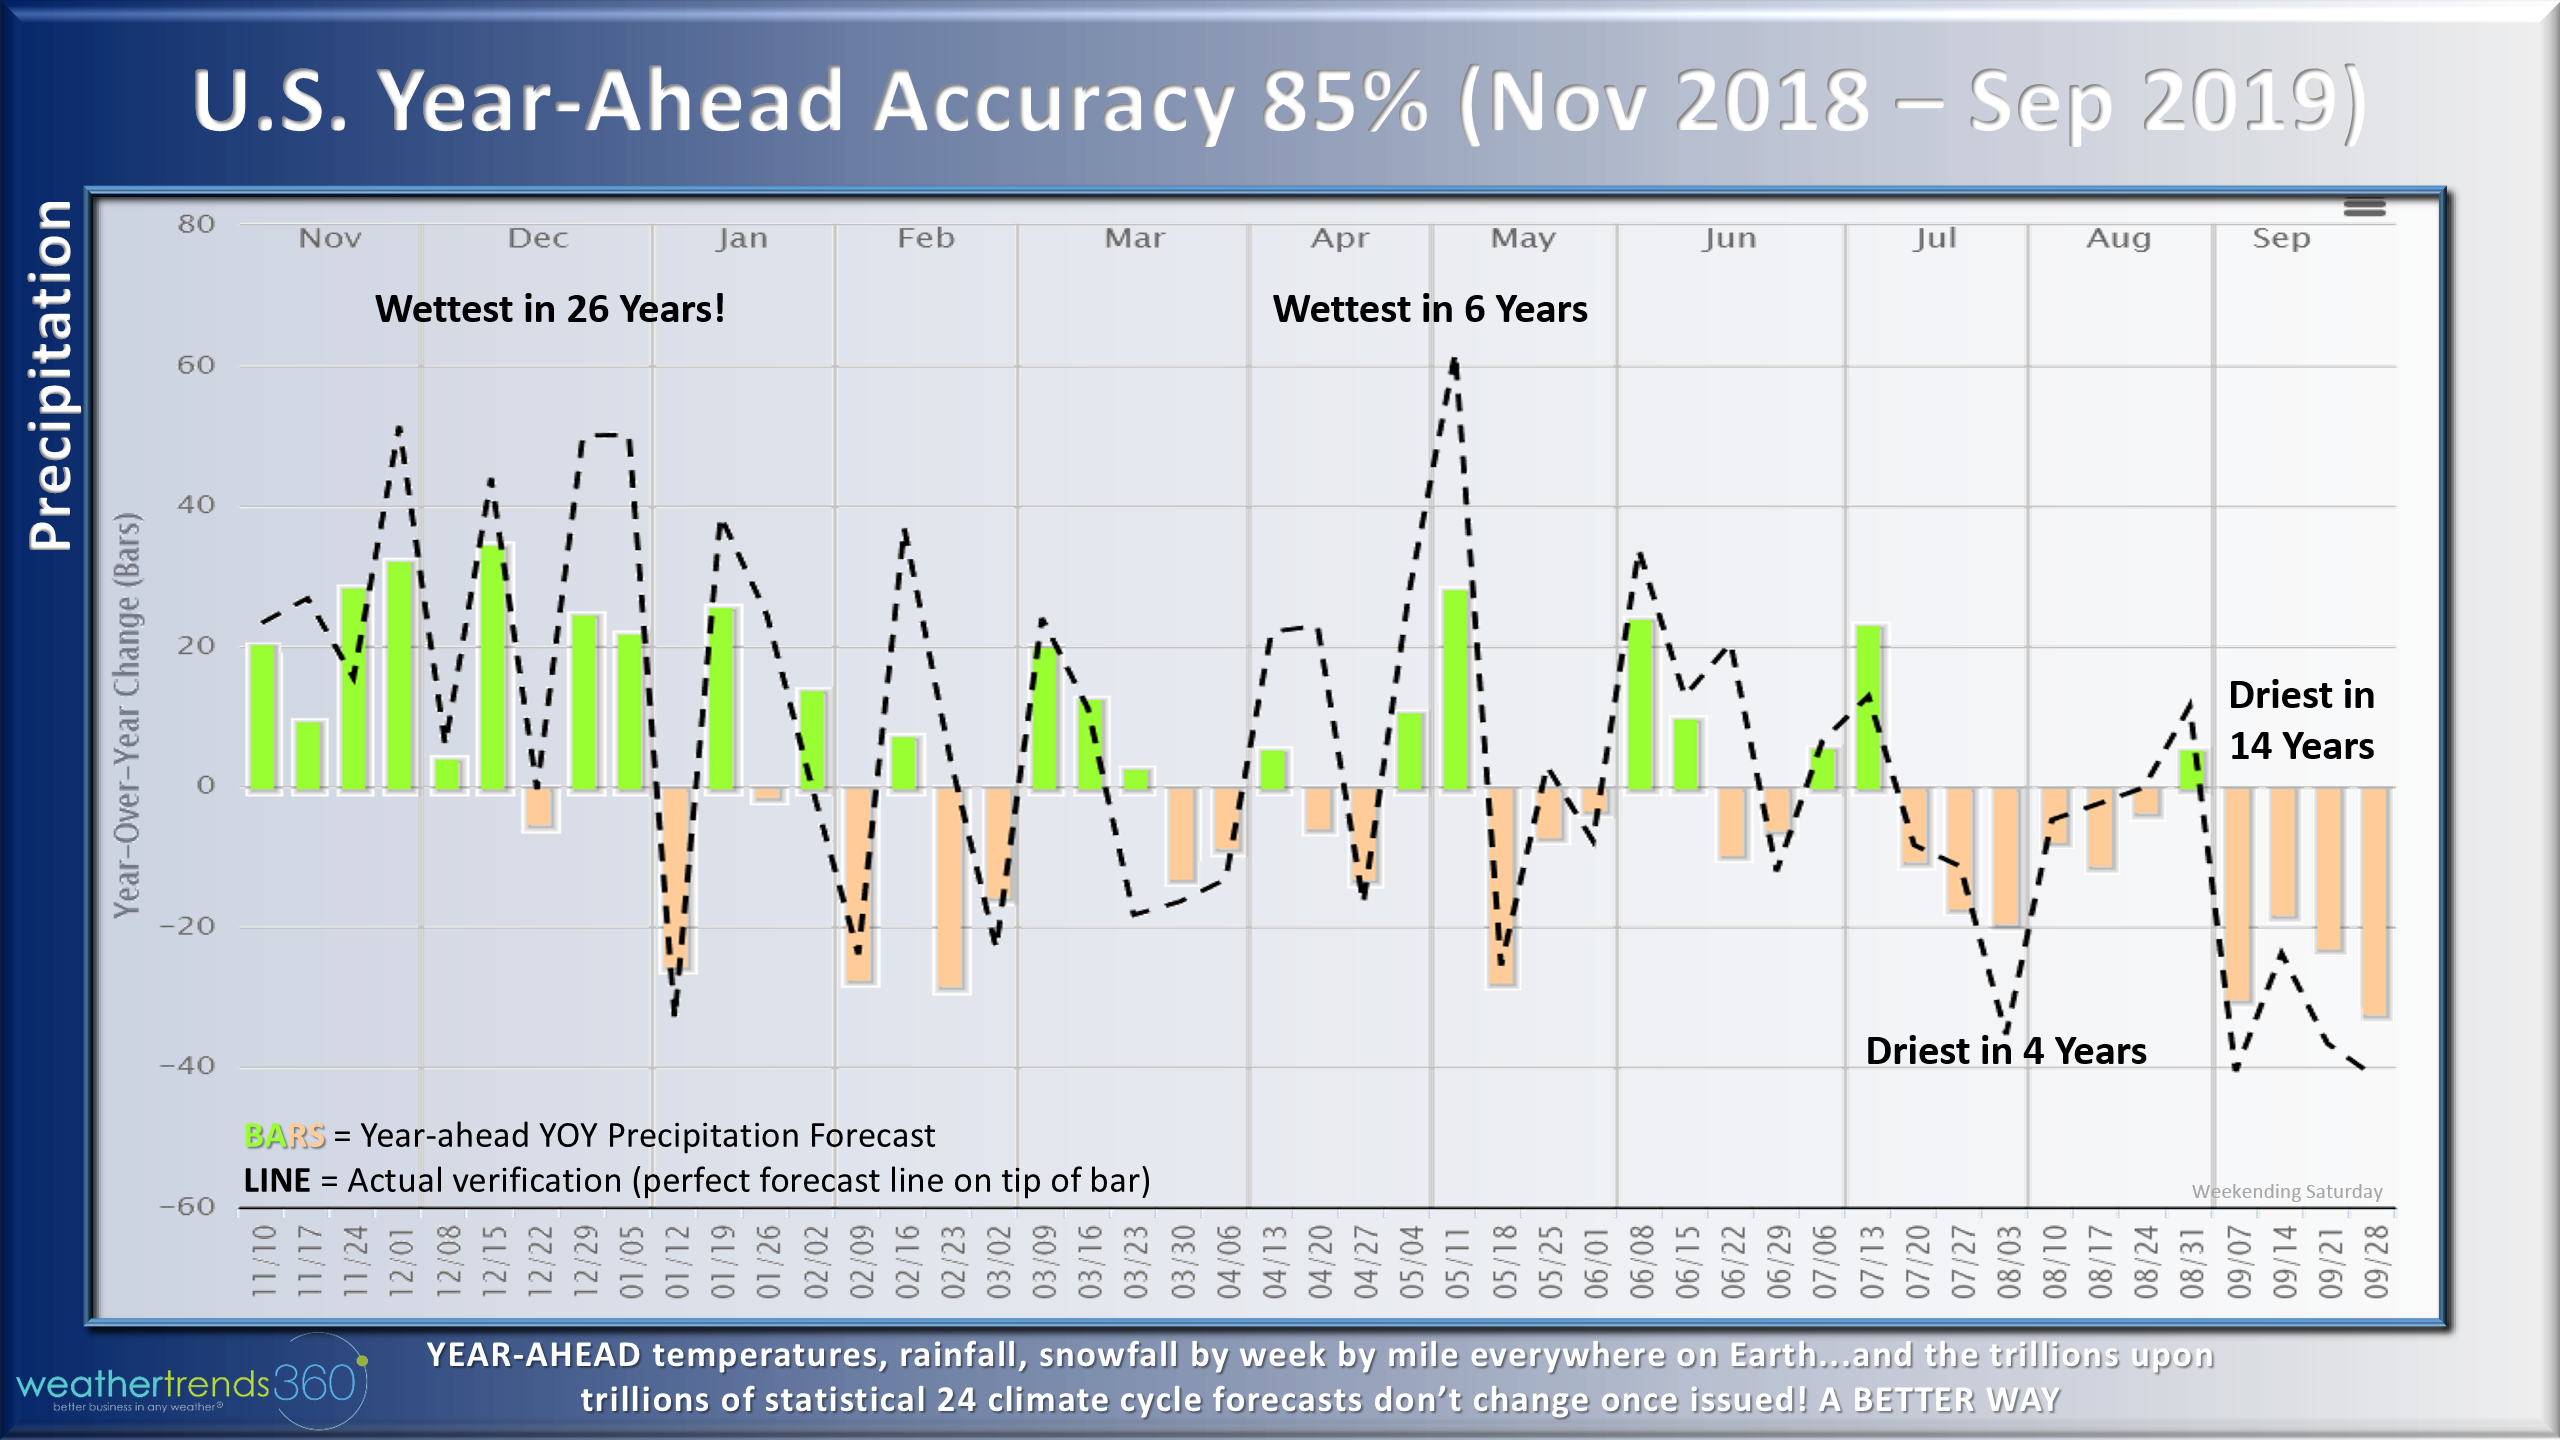
Our year-ahead accuracy using statistics and 24 climate cycles has been trending at the high end of our scale at 87% for temperatures and 85% for precipitation. Year-Ahead accuracy down to a city is usually in the 70% to 94% range.
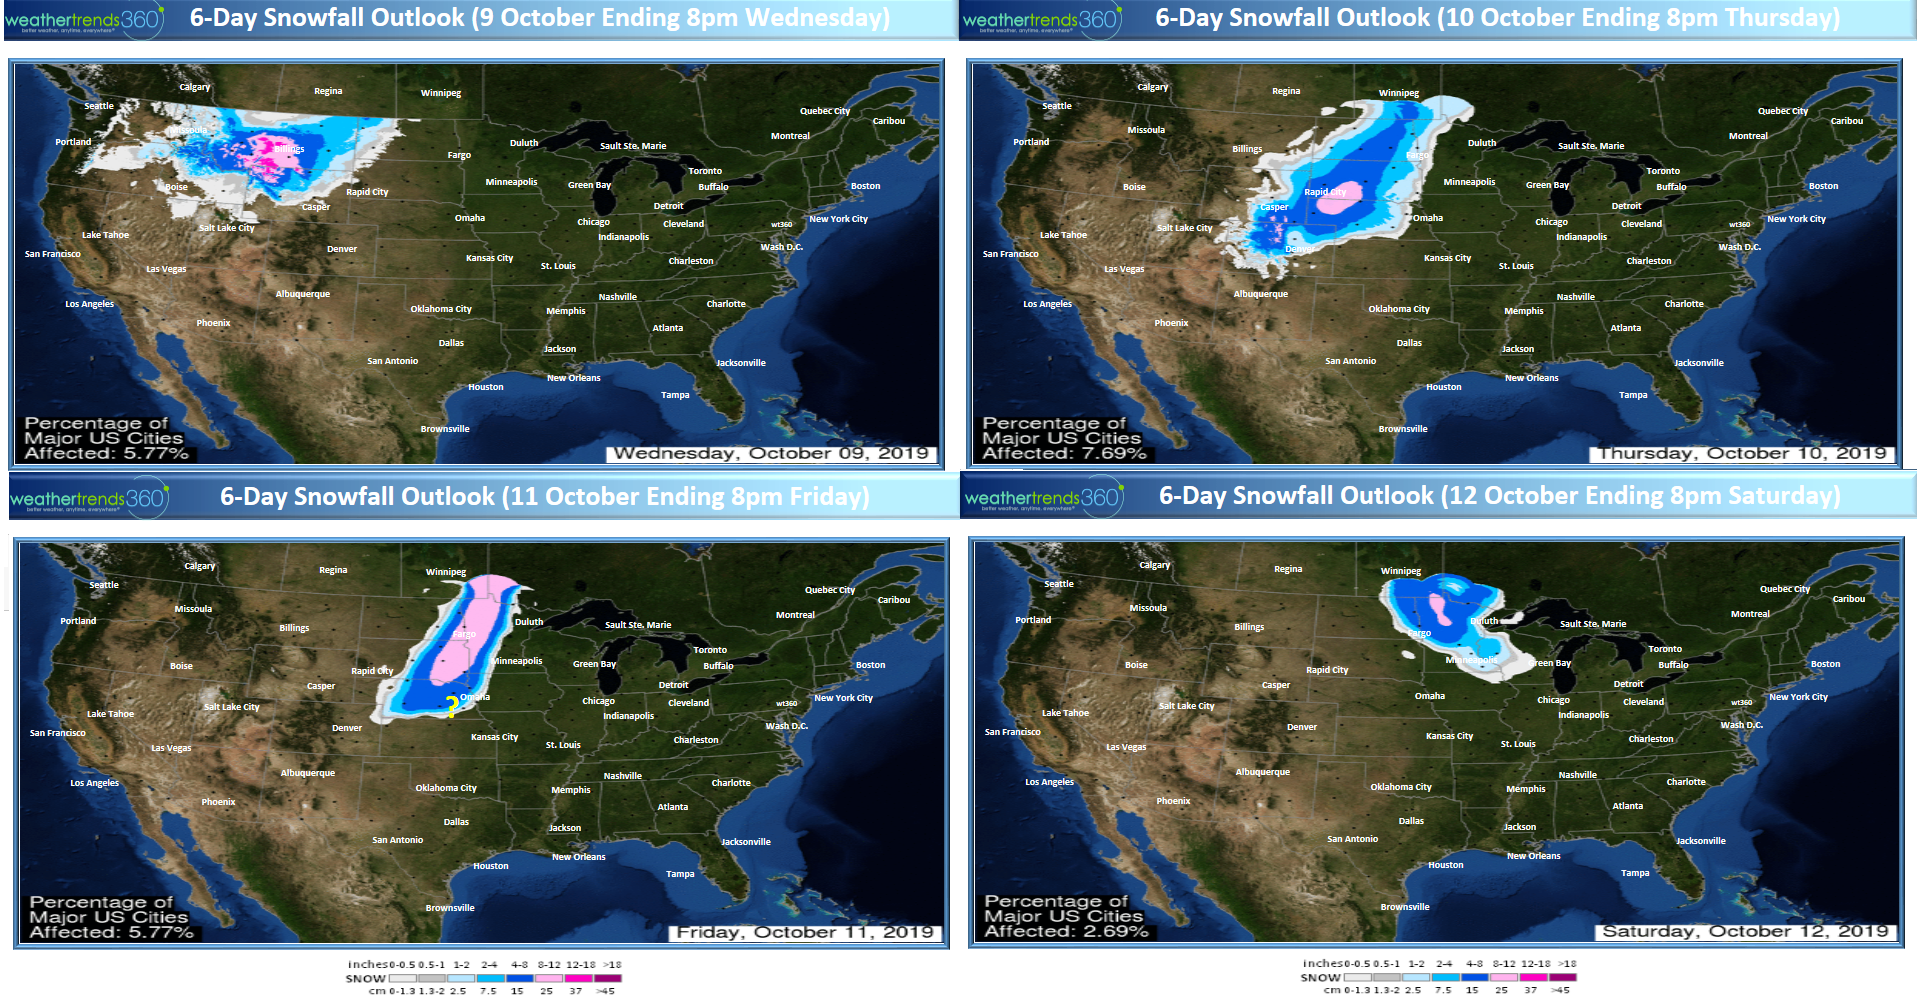
In the short term we're looking at another middle Fall snow storm for the Northern Rocky Mountains and Upper Plains later this week. It will be a wet snow so it won't stick around long in the Plains.
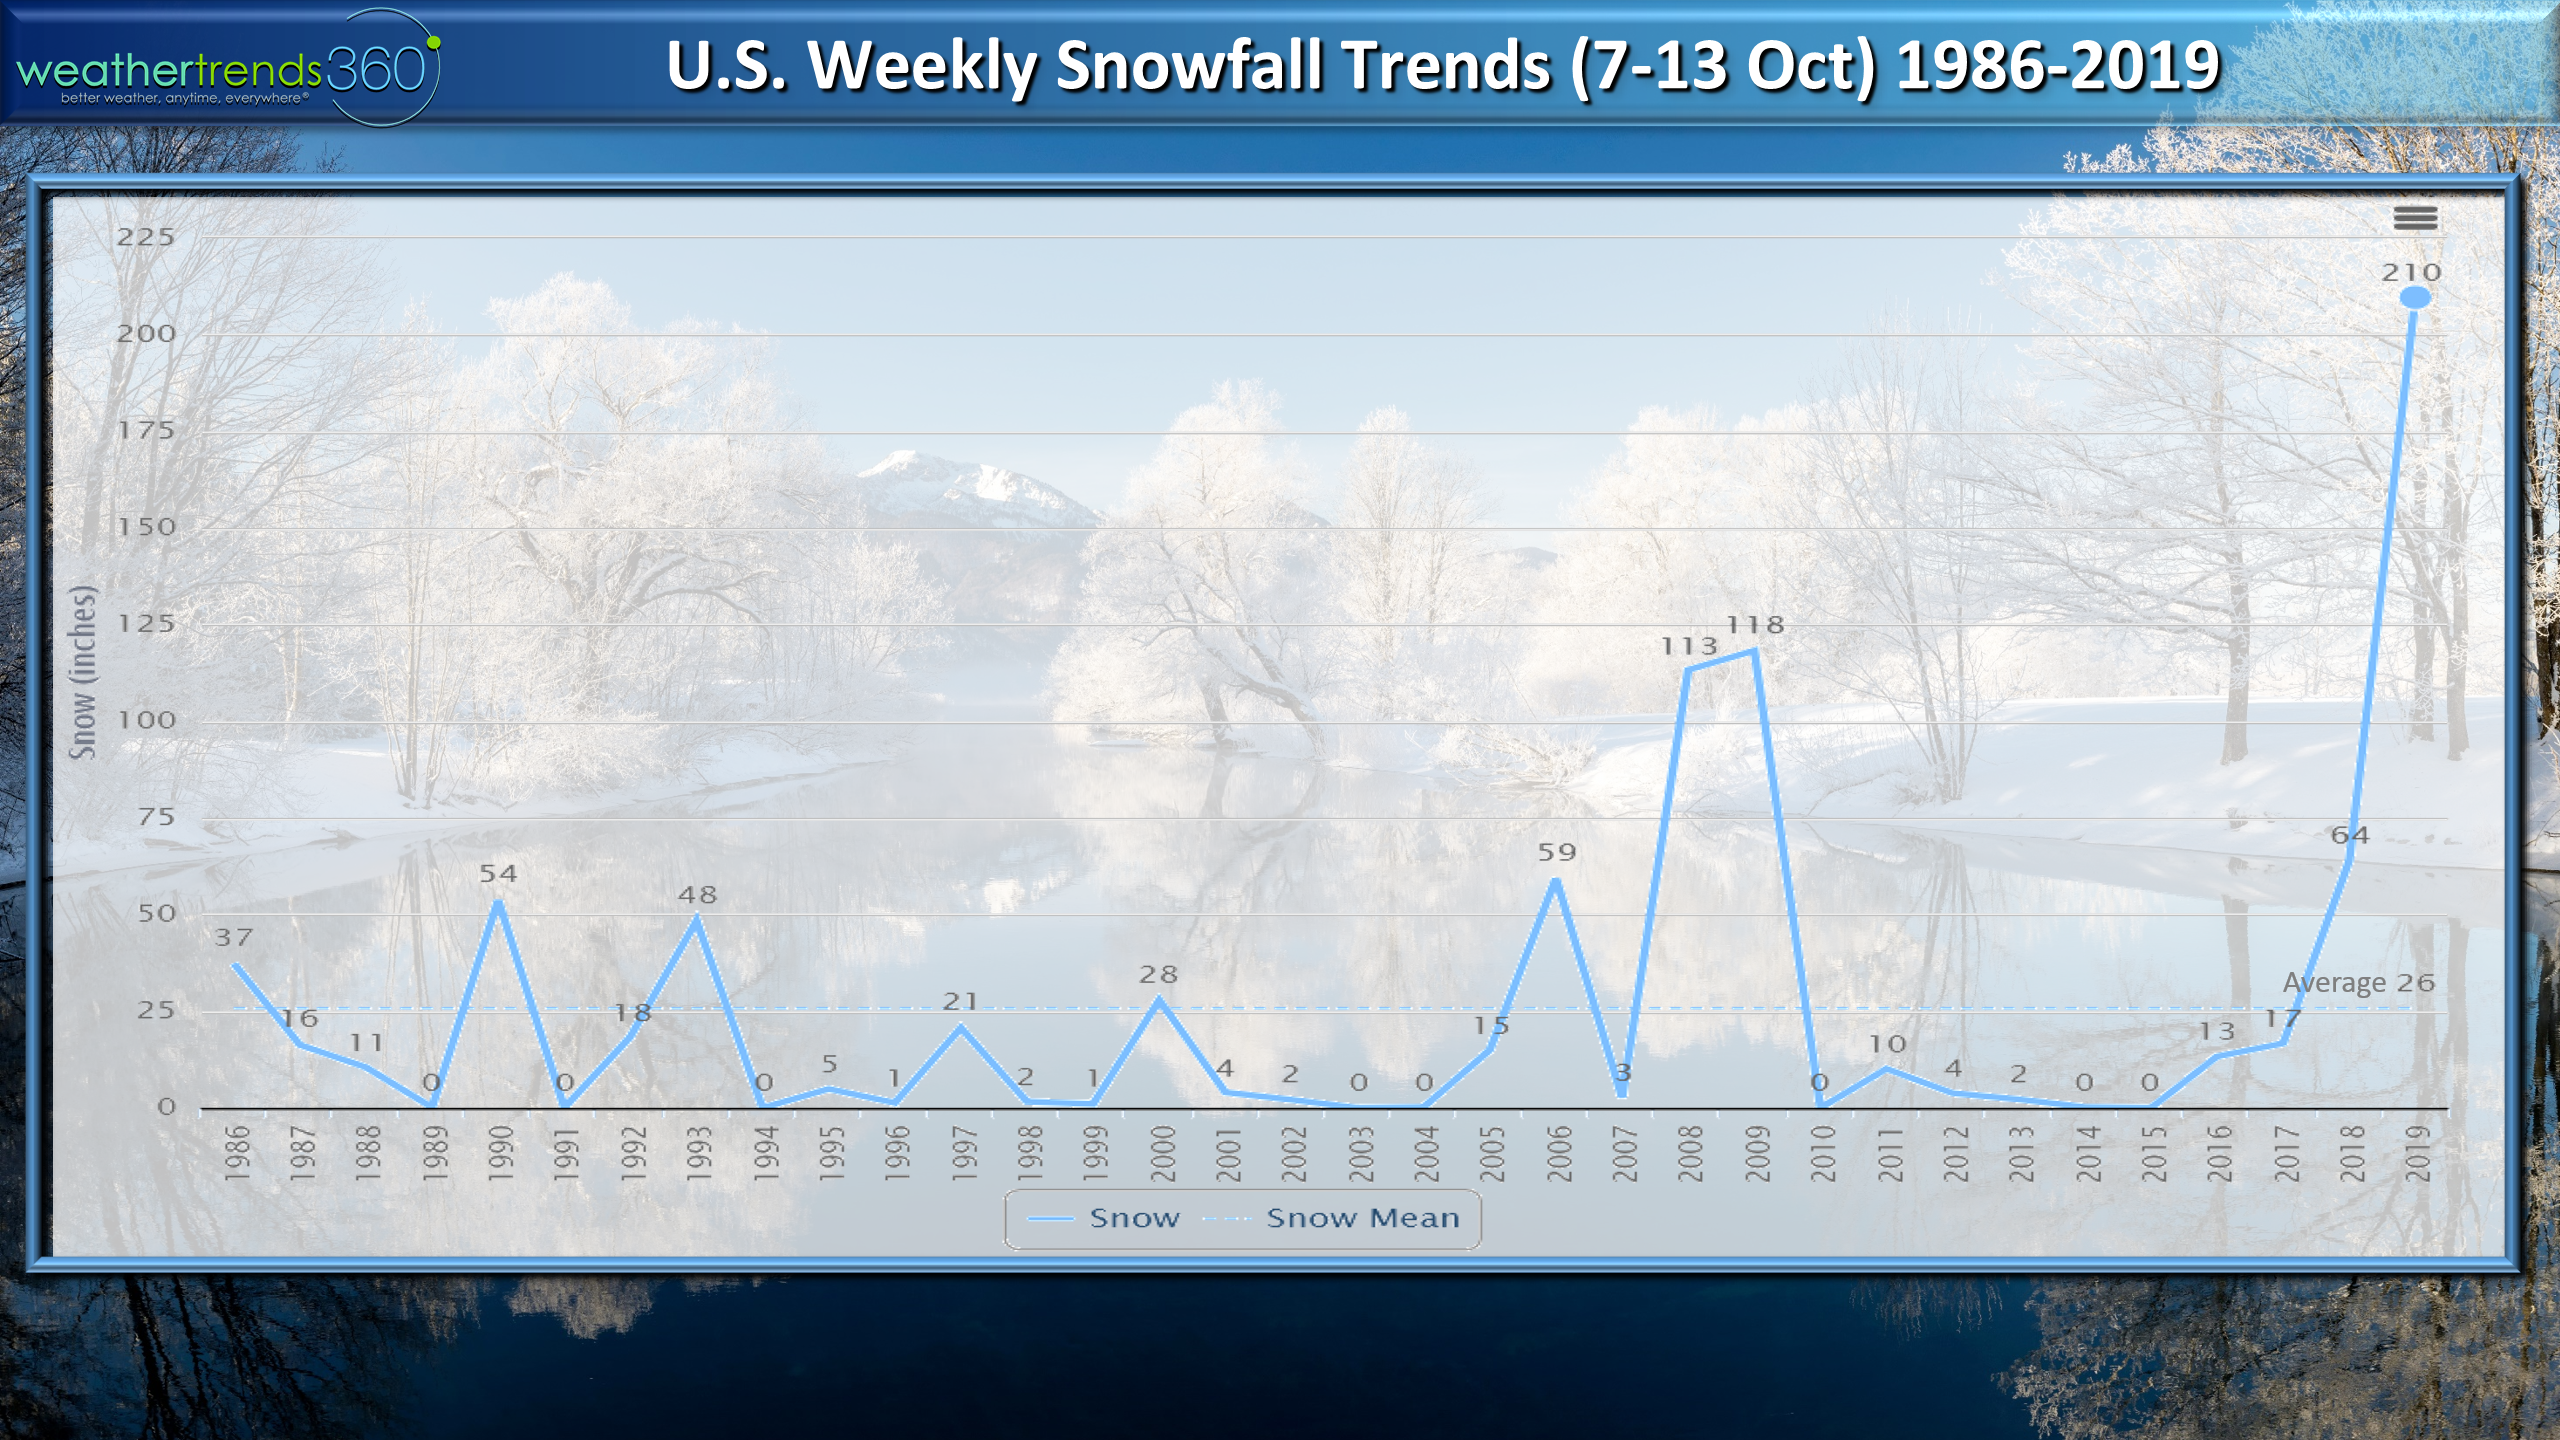
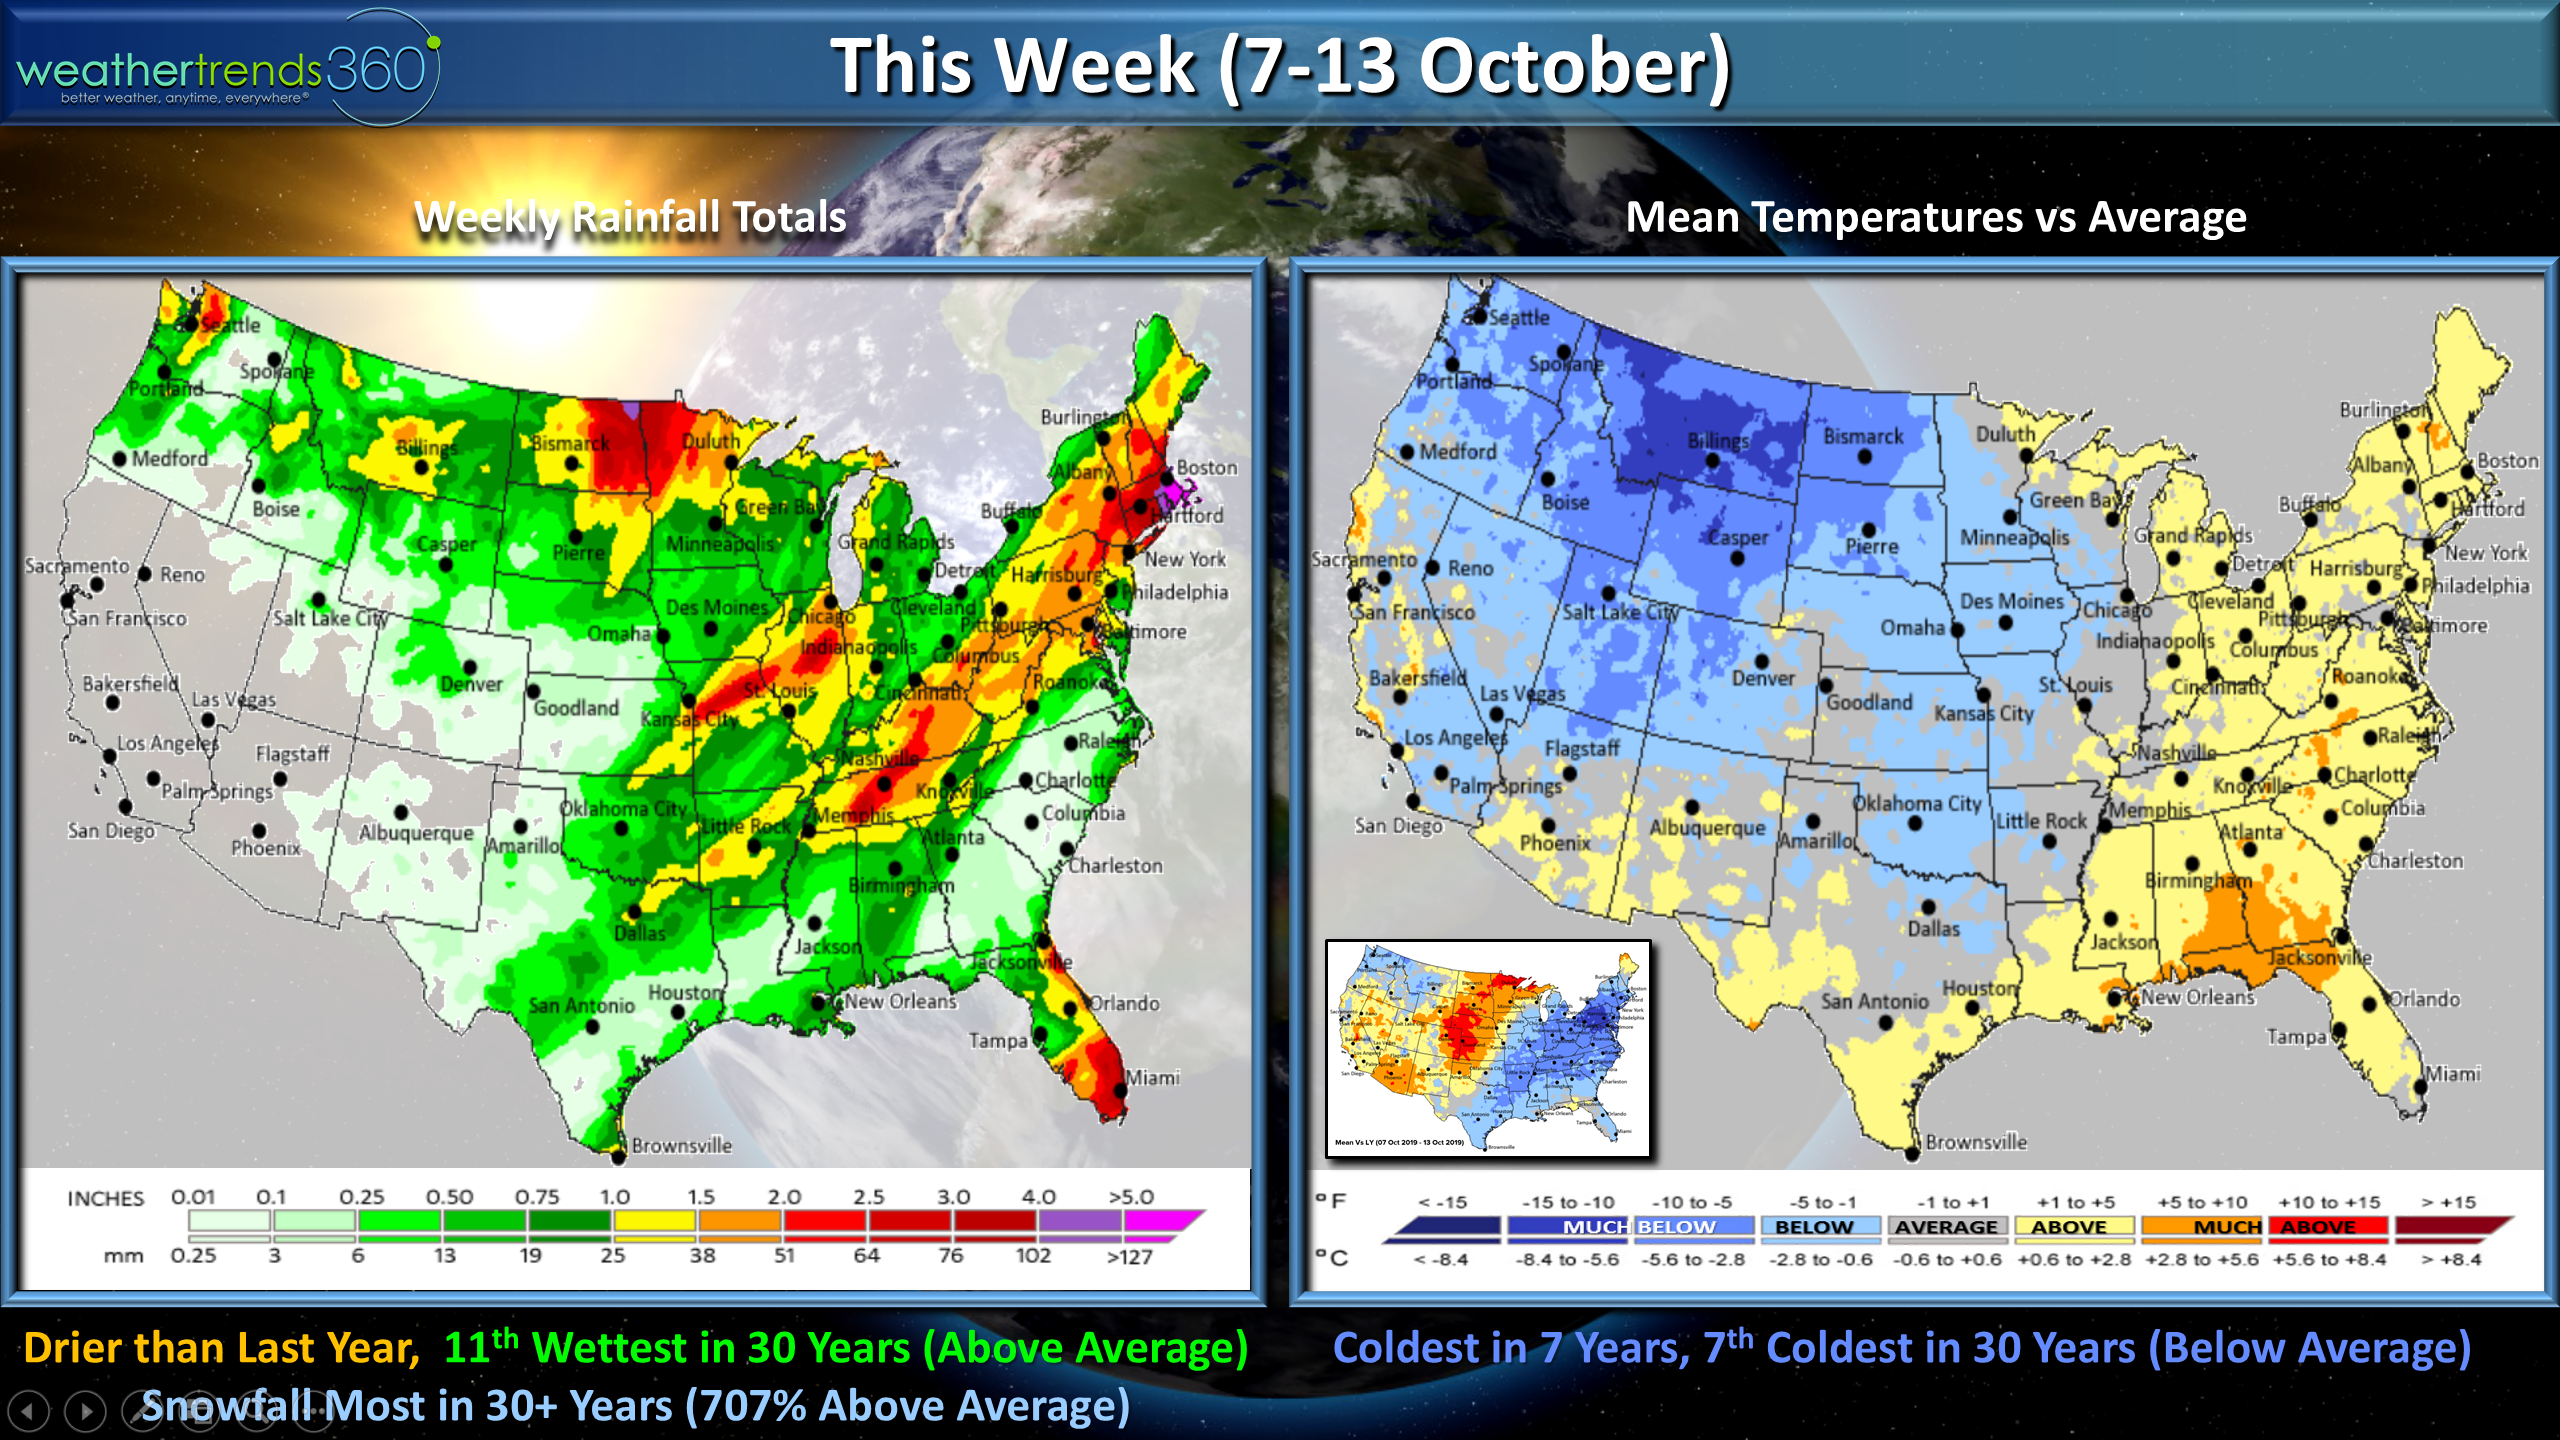
This week's U.S. snowfall index is literally off the charts with the most snow in 30+ years, again all confined to the Rocky Mountains and Plains.
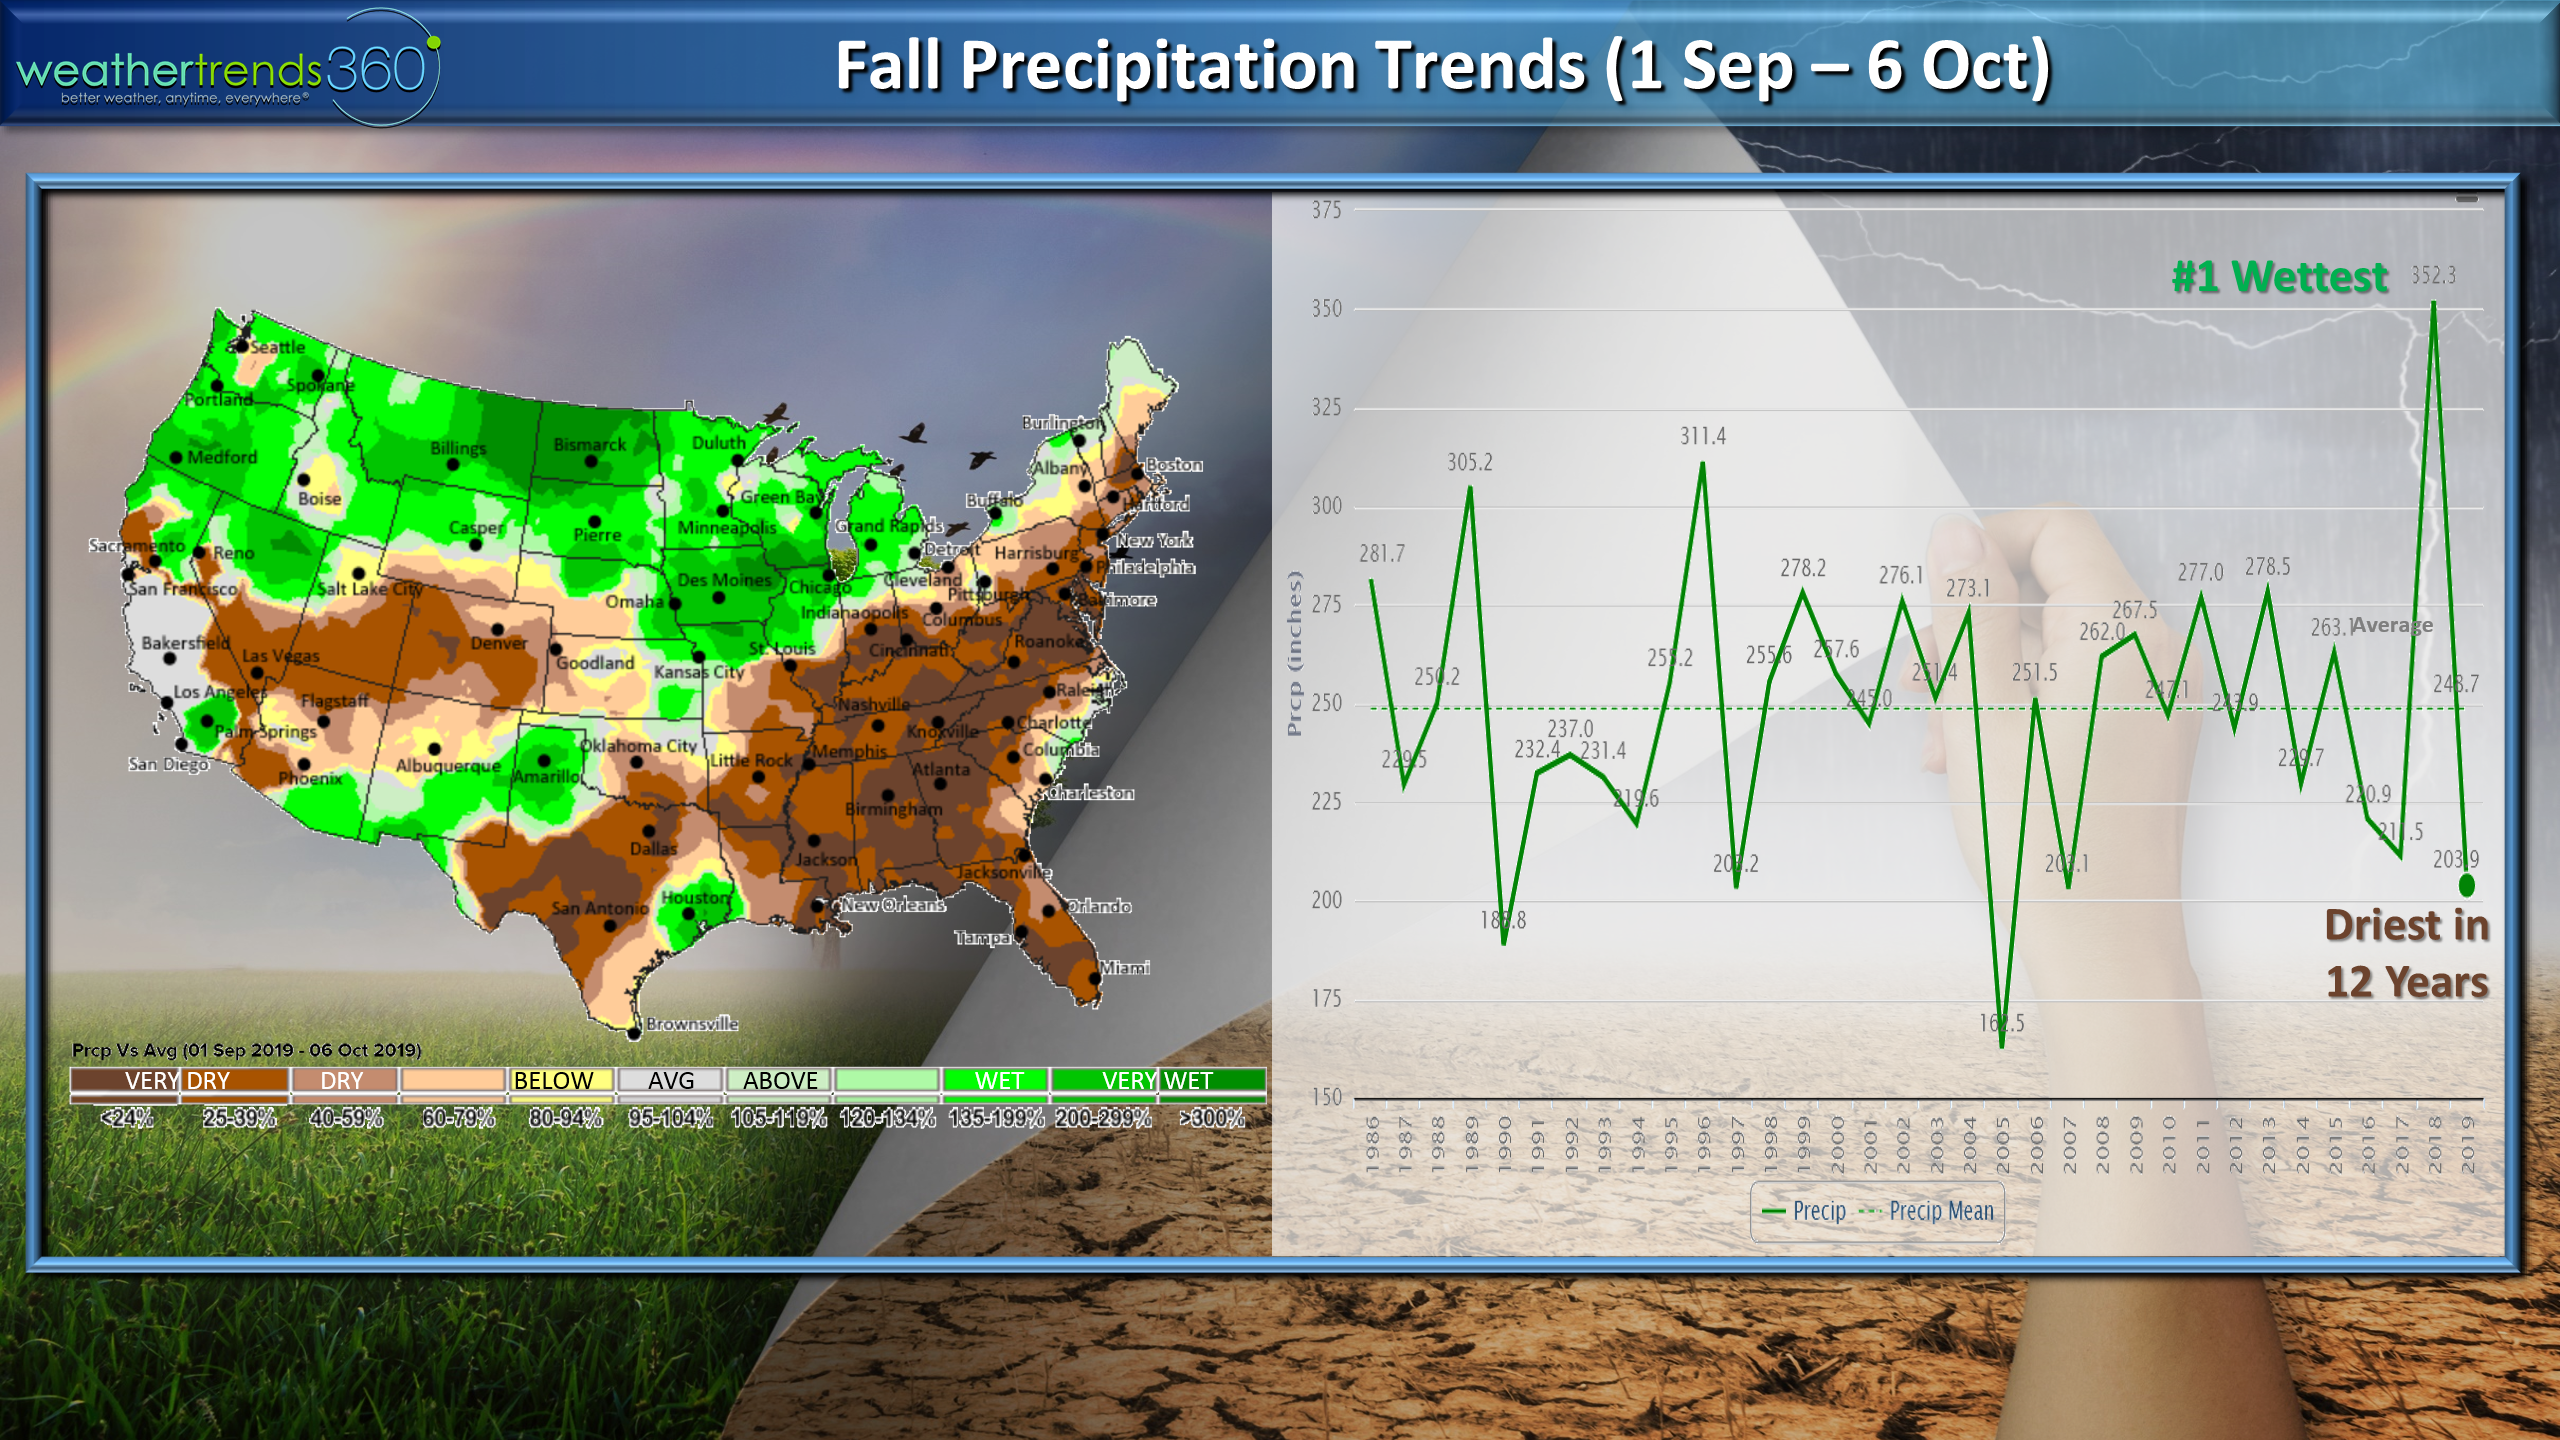
The other index that's made a big move is U.S. rainfall this Fall (1 Sep - 6 Oct) trending driest in 12 years nationally, a wholesale change from last year's wettest start to Fall in decades. Texas to the Northeast and pars of the Southwest have been exceptionally dry with wetter weather in the Pacific Northwest and Upper Midwest.
This week (7-13 Oct) another cold front will sweep the U.S. but the heart of the cold is in the Upper Rocky Mountains and Plains while the East generally trends above average for the week overall. But, compared to last year the East Coast is much colder than the year ago period.
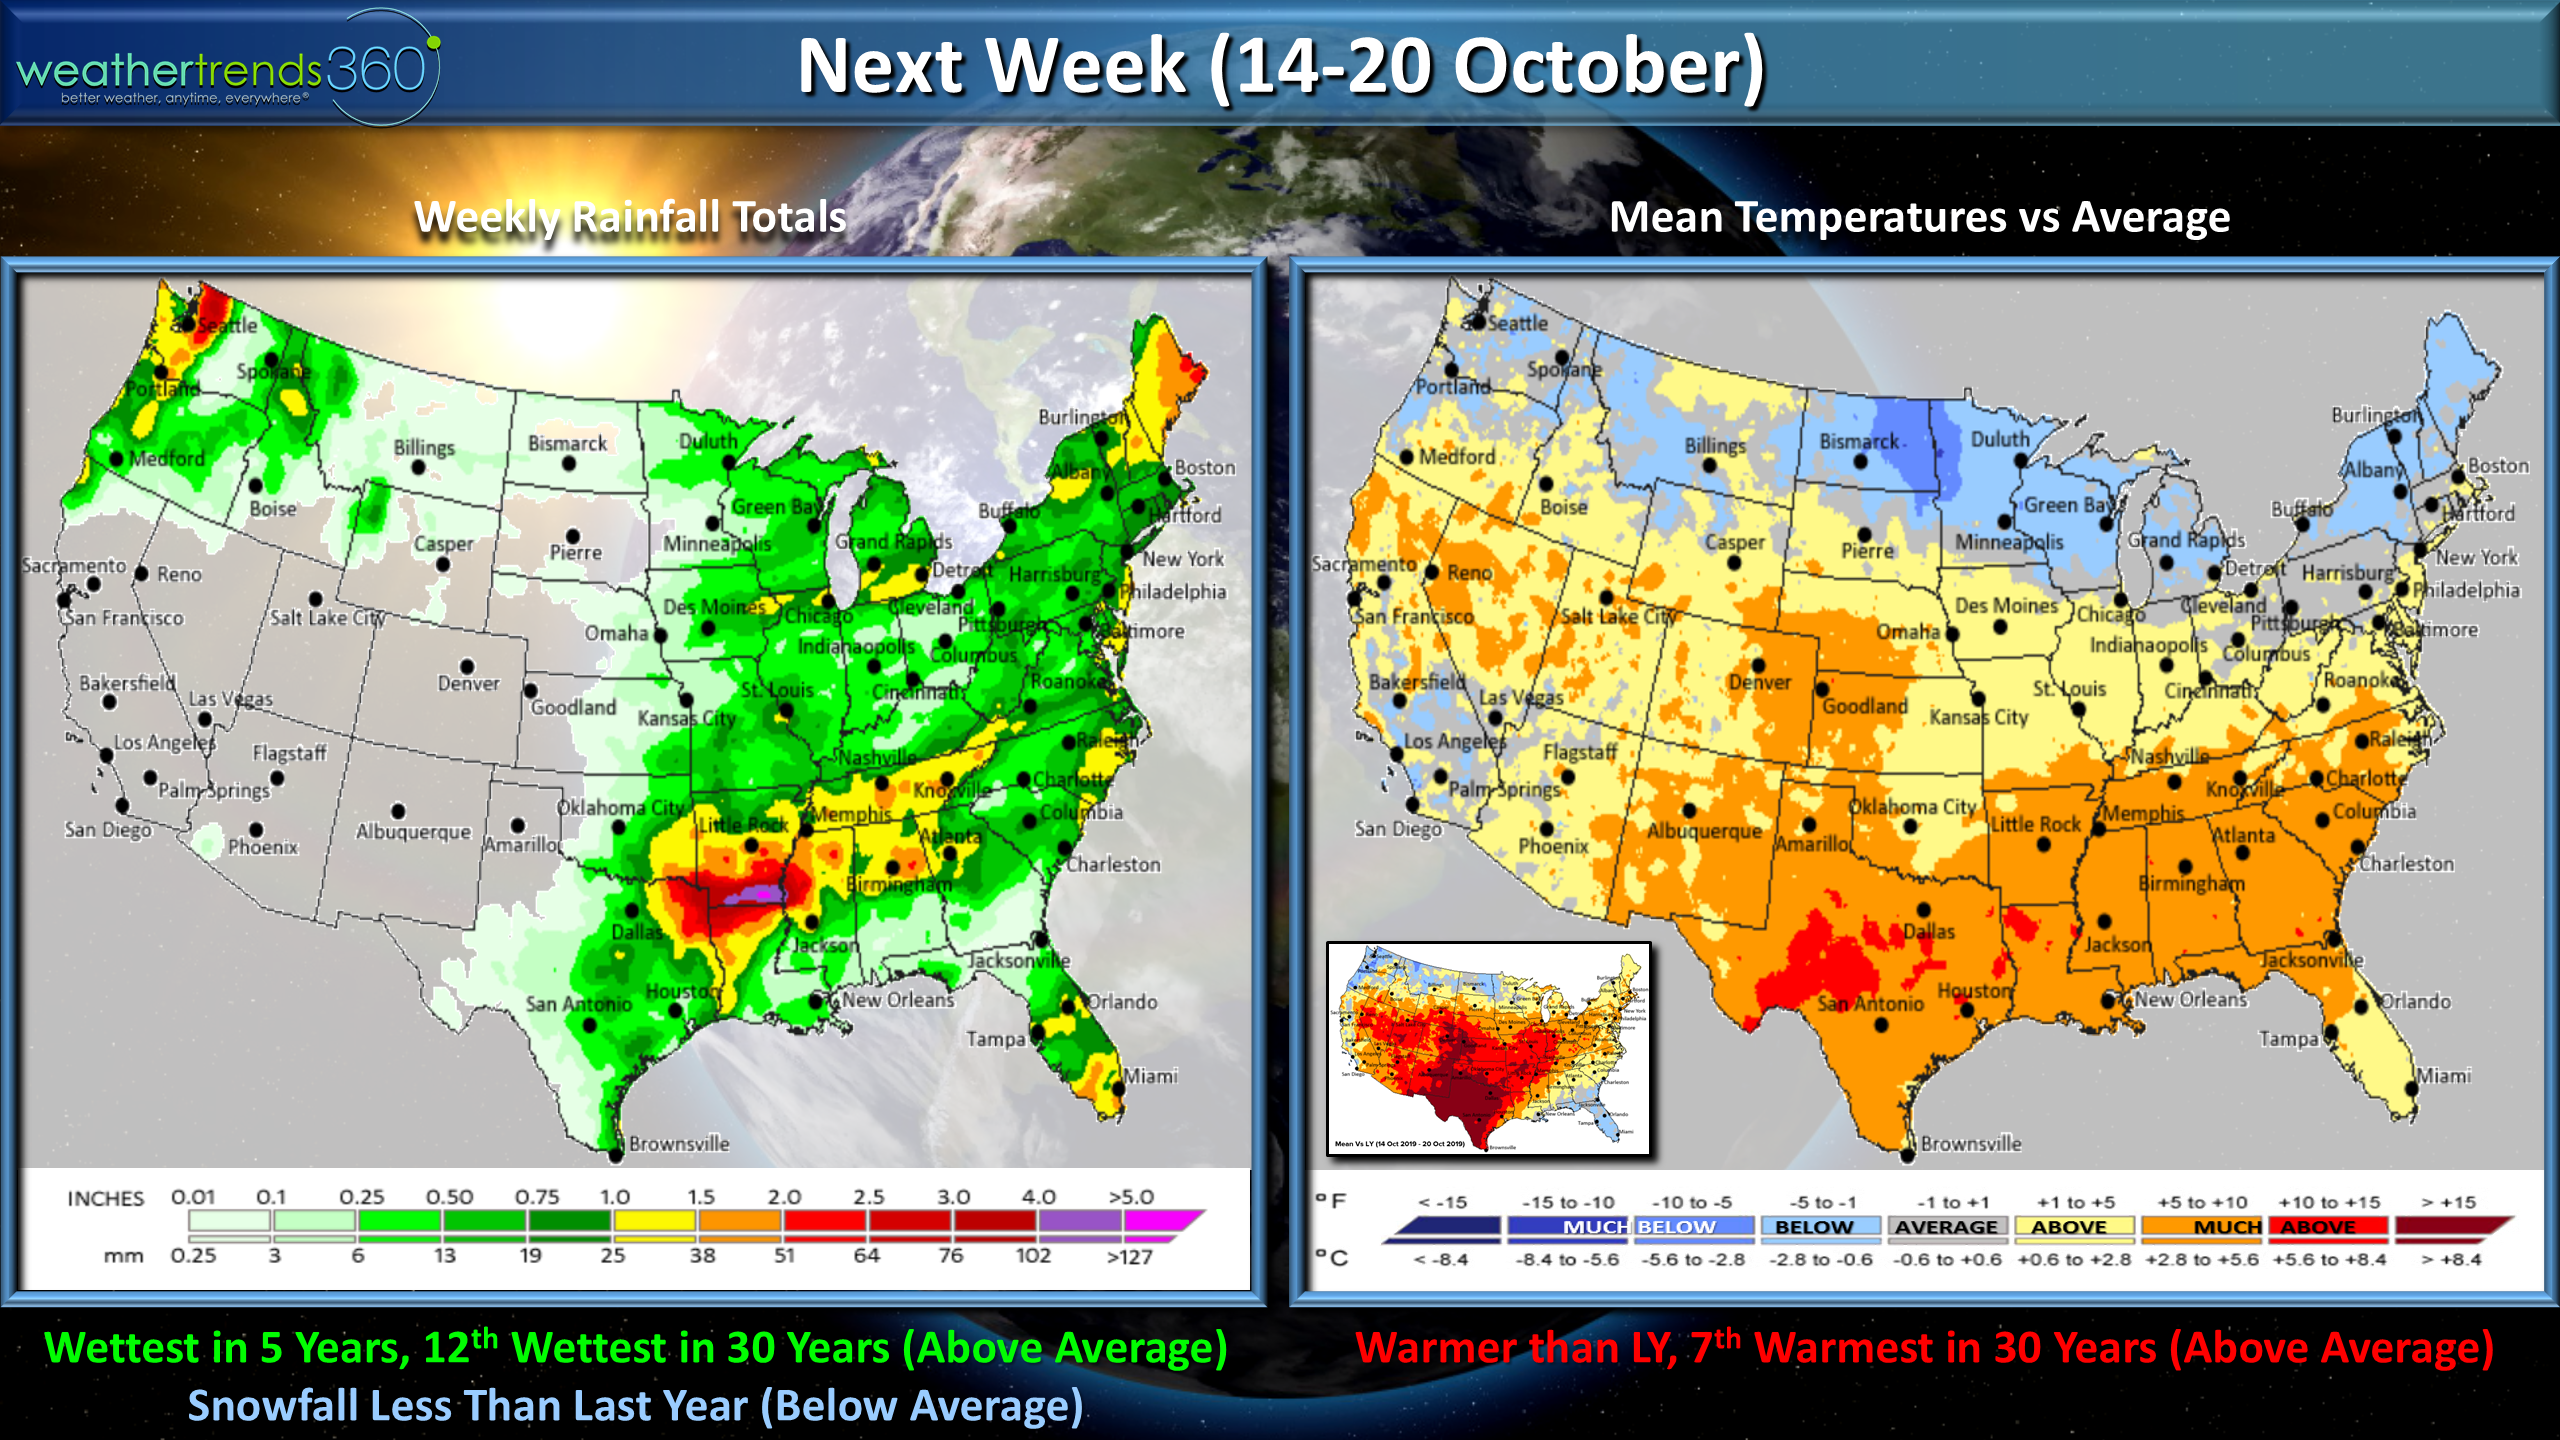
Next week (14-20 Oct) trends quite a bit warmer both vs average and last year for all but the northern tier of the U.S. Rainfall is up a bit but snowfall will be way down vs last year.
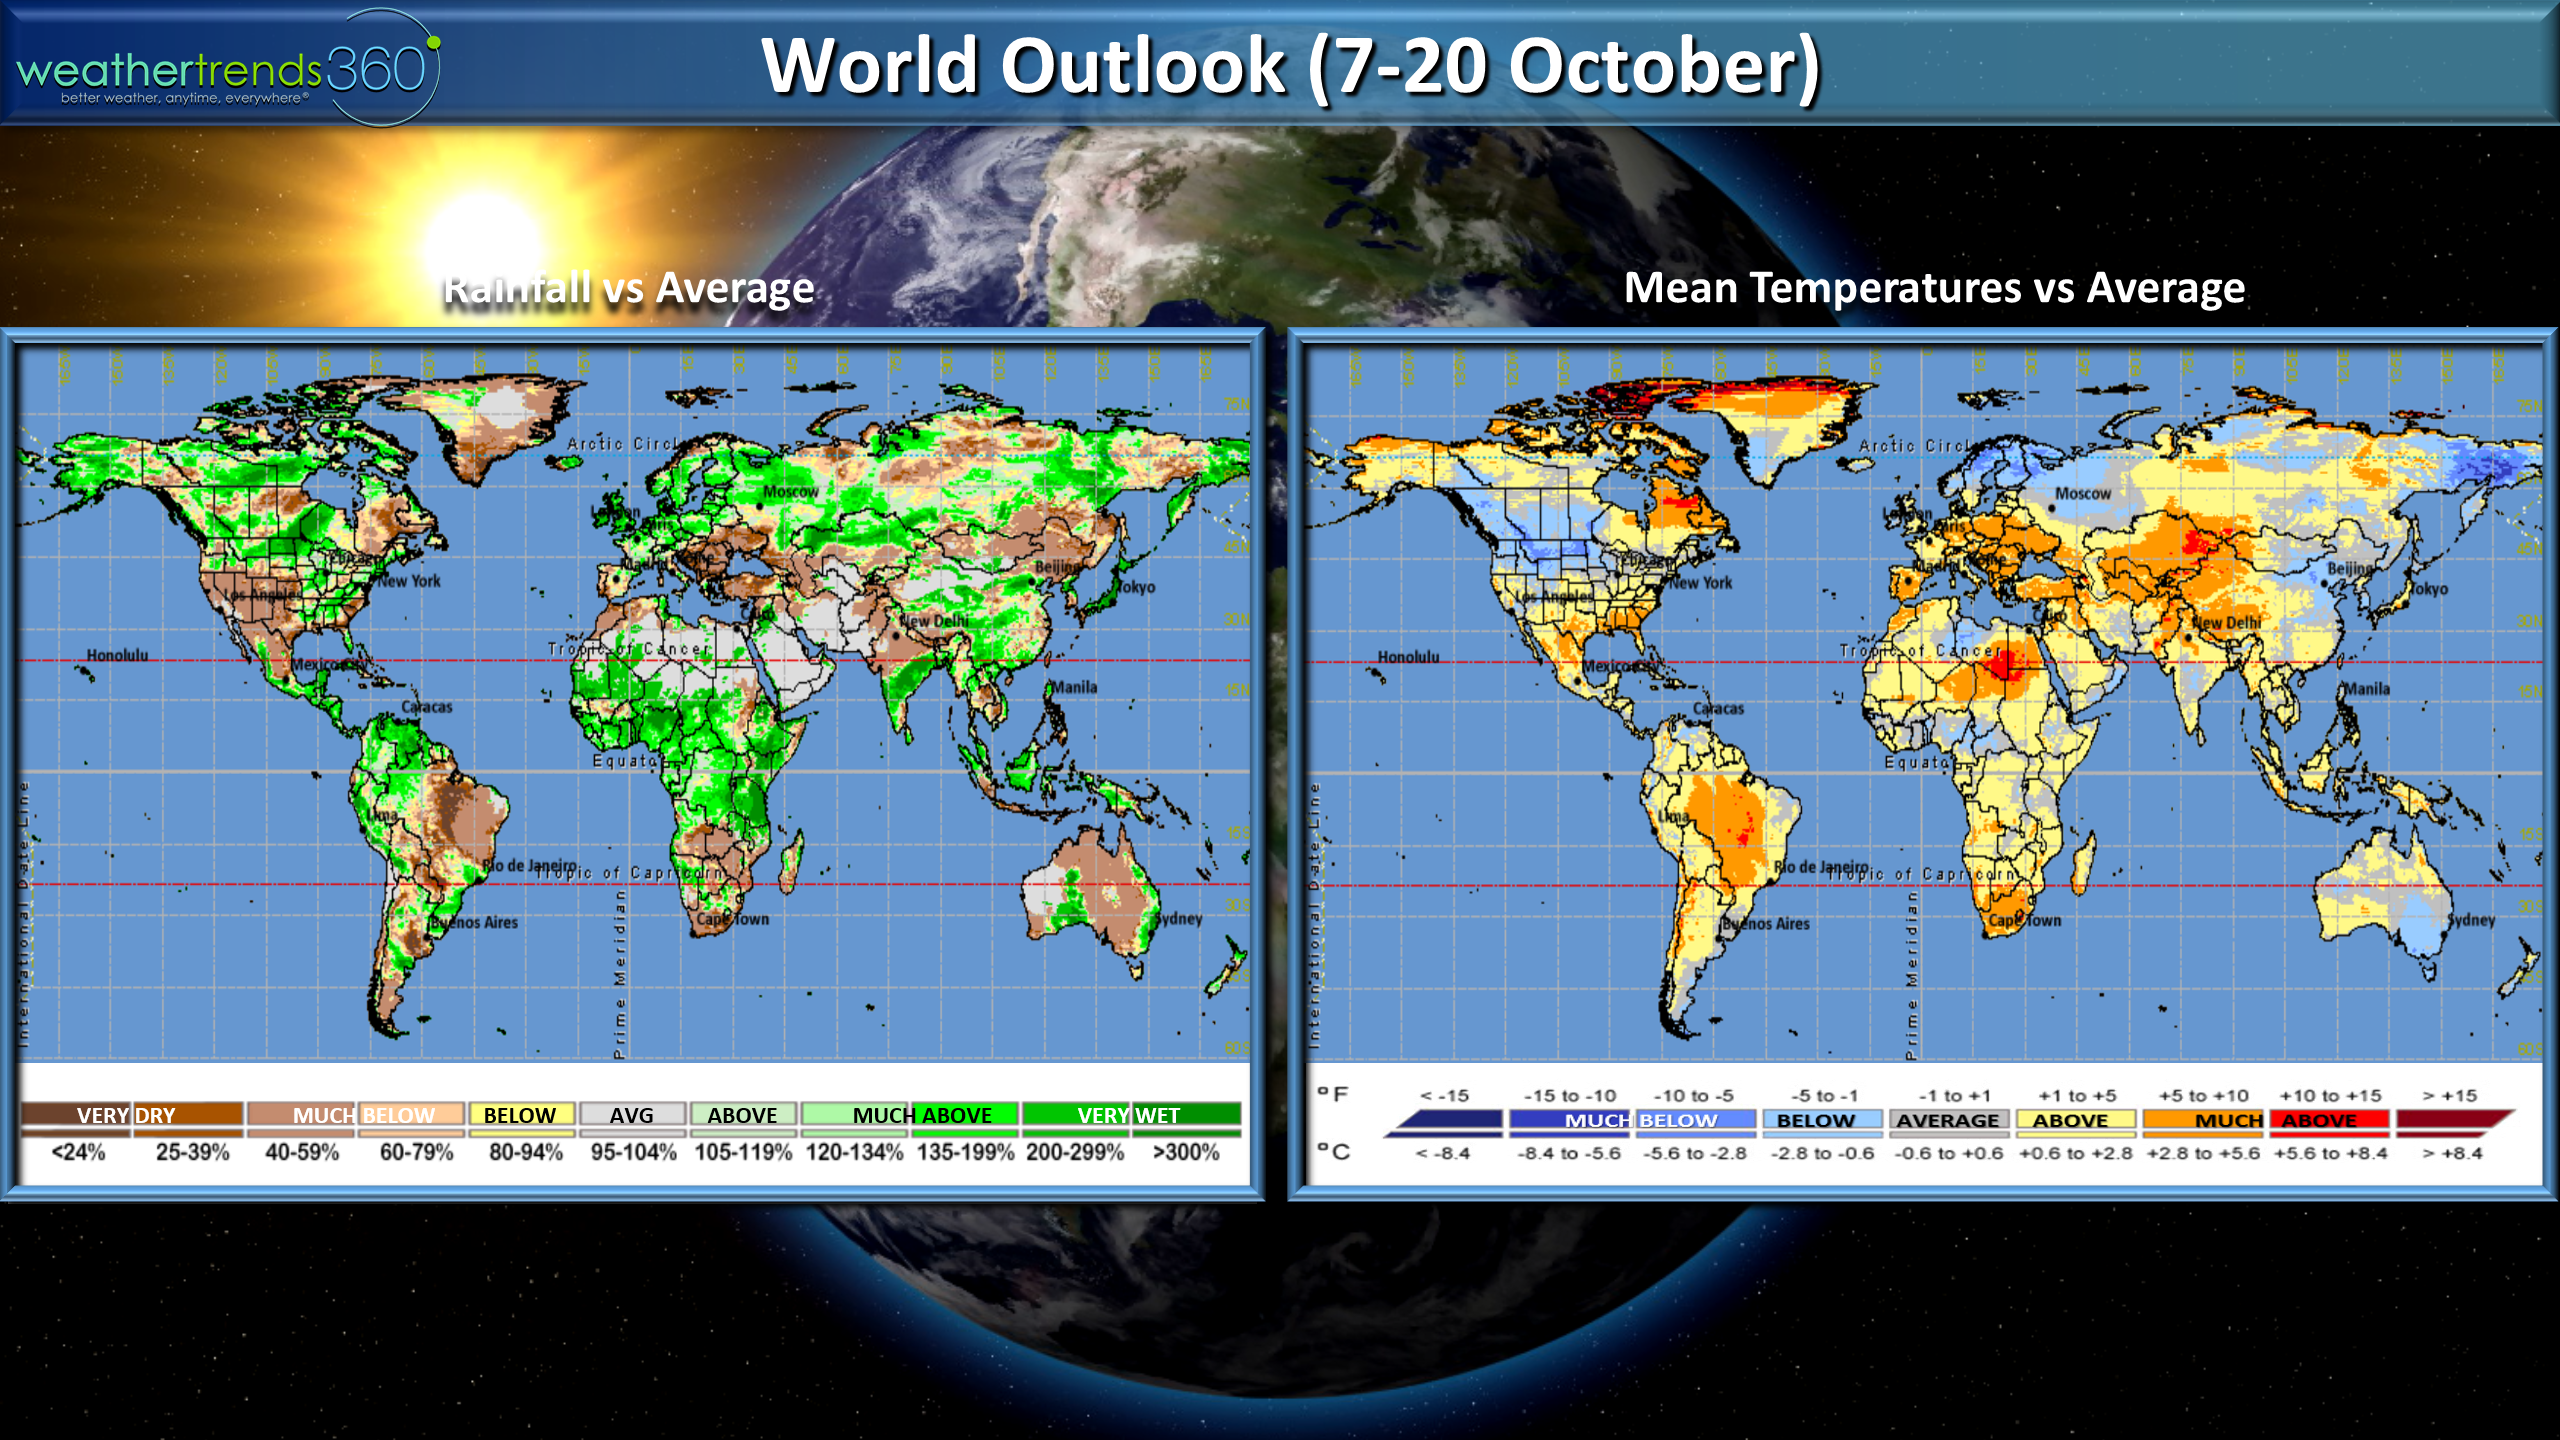
The 2-week world aggregate shows most of the World having a milder middle October period.
Have a great week and don't forget to follow us on social media for frequent updates. Facebook, Twitter, YouTube, Pinterest and Linkedin
- Captain Kirk out.