March 2016 Weather Roundup
Business
March 2016 will go down in the record books as the 2nd hottest in 121 years for the U.S. as a whole. This is a wholesale change from the past few years that were much colder and snowier. Every state in the U.S. had above to much above average temperatures. The Upper Plains had the greatest trends of above average temperatures while extreme northern Maine was the only spot with slightly below average temperatures.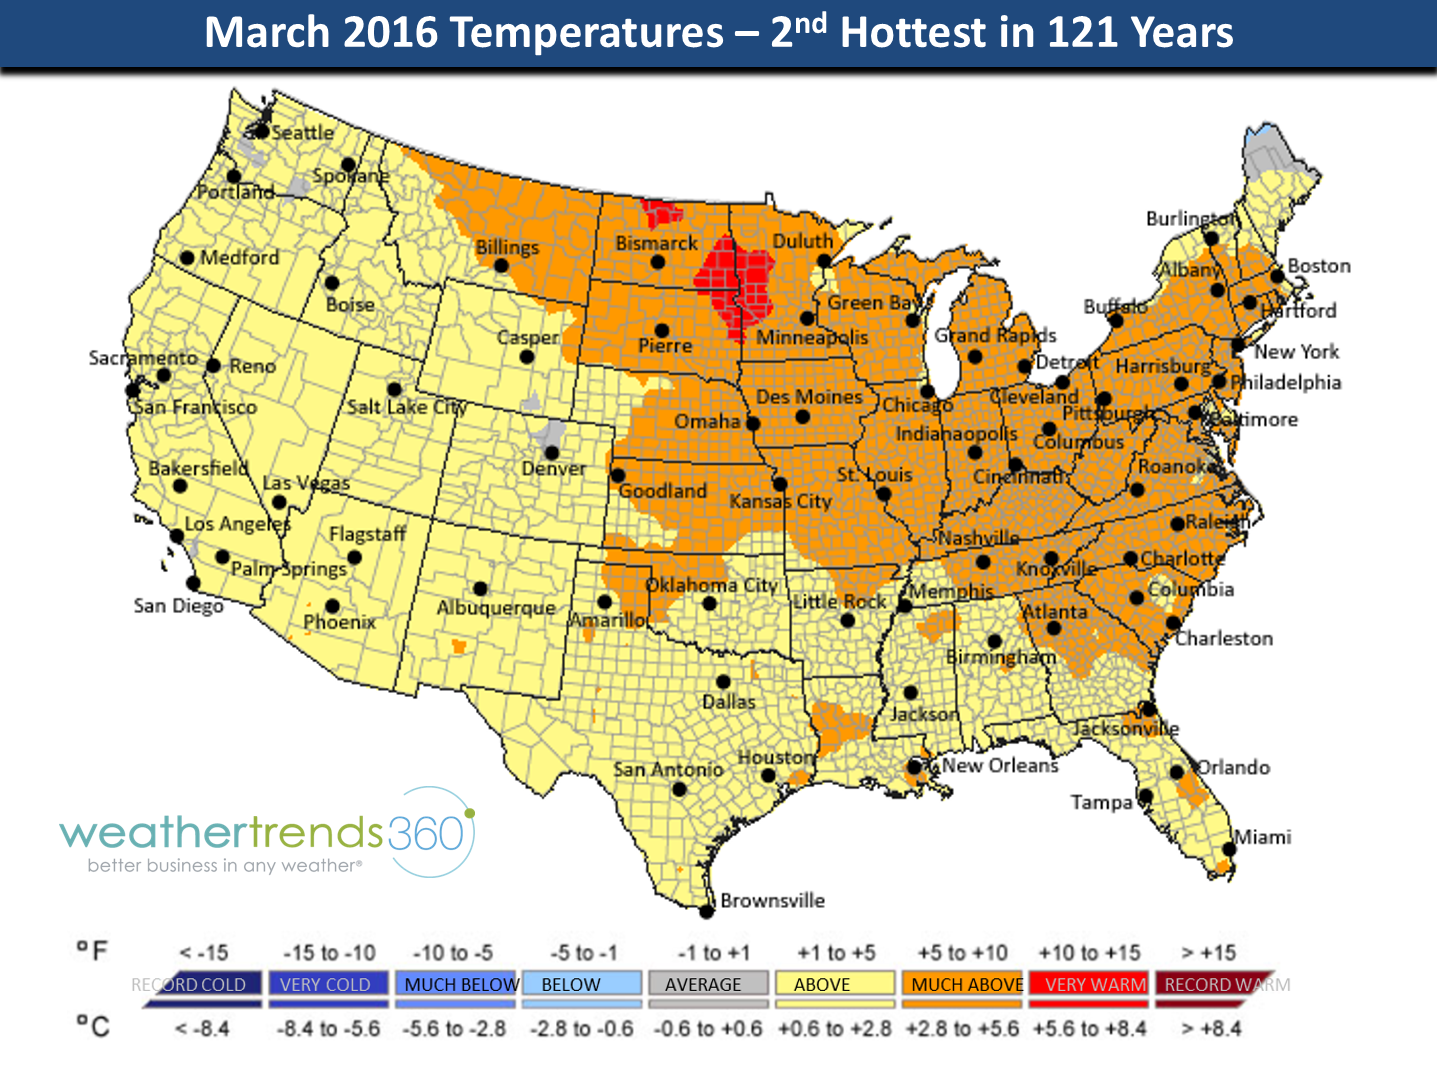
Compared to last year the greatest changes were in the Northeast while the West trended cooler year-over-year.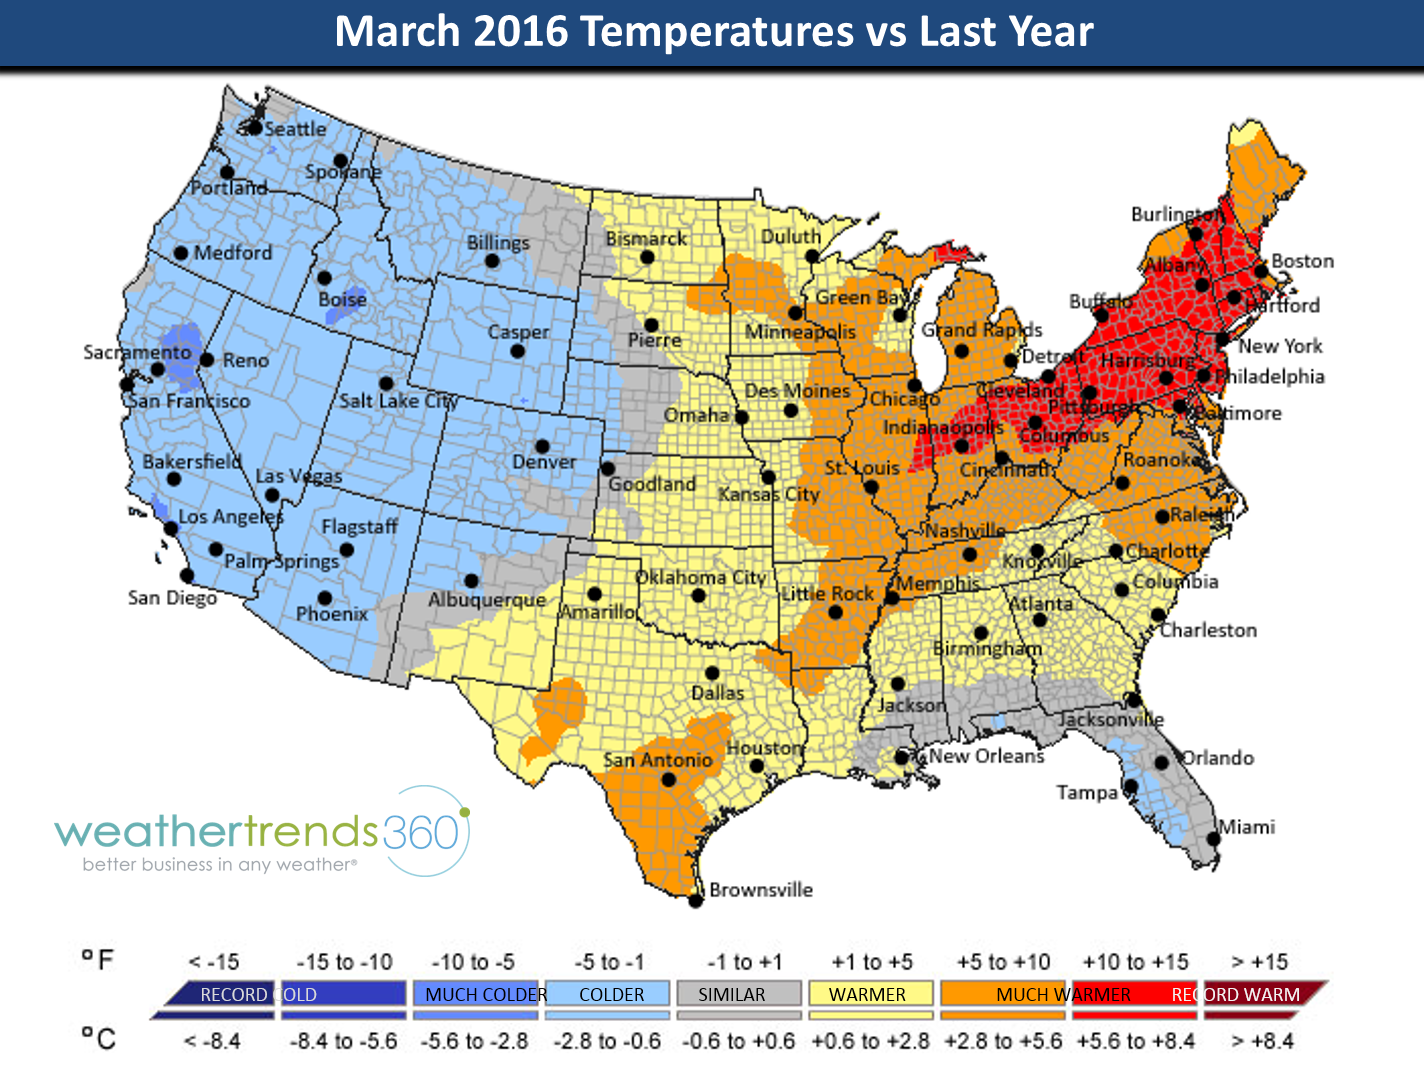
Max temperature trends for the U.S. as a whole show the dramatic change from the prior few years. 2016 was not as hot as 2012 but a close second.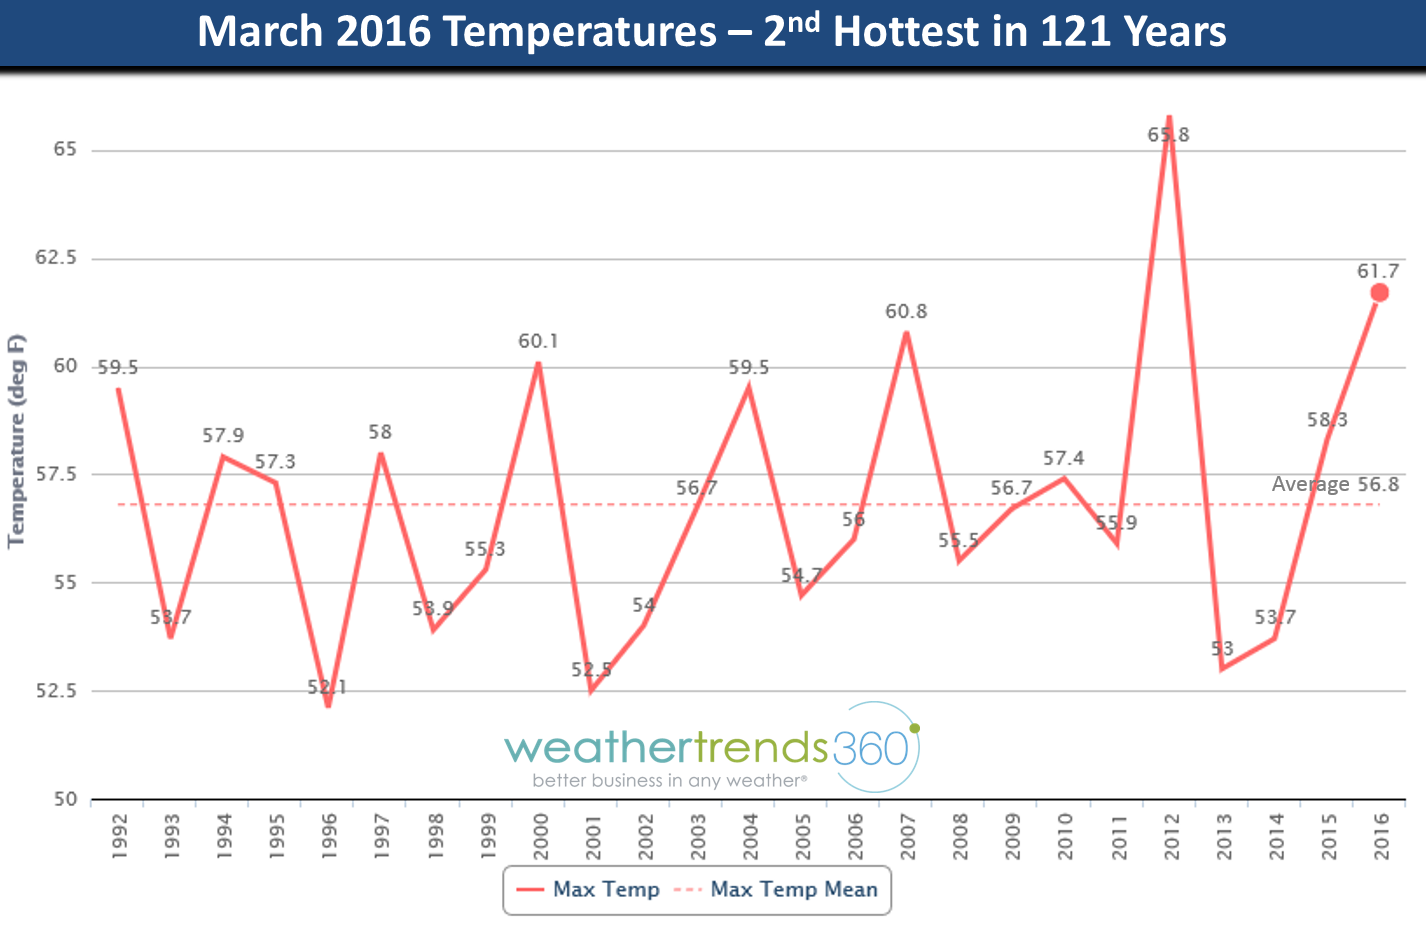
Globally the cool spots were in Northeast Canada, Western Europe, Northwest Africa and Argentina.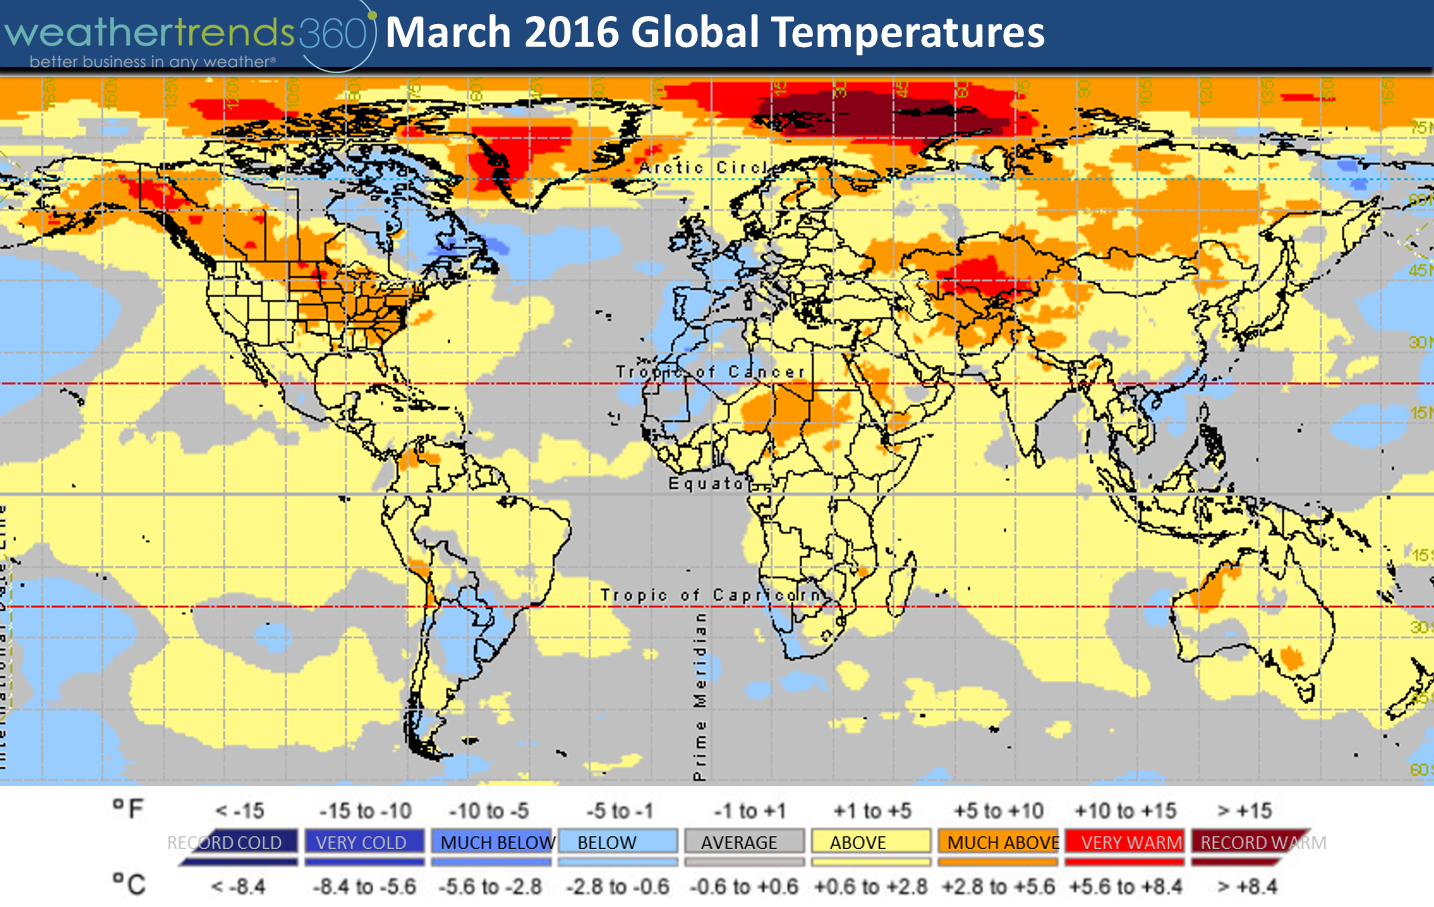
Rainfall totals across the U.S. were heaviest down in Northeast Texas but a bulls-eye of epic rain totals over 16-20"+ in Northern Louisiana and Southeast Arkansas where there was major river flooding. North Central California was also a big winner with rainfall bringing most of the huge lake reservoirs above average and near capacity with a "Miracle
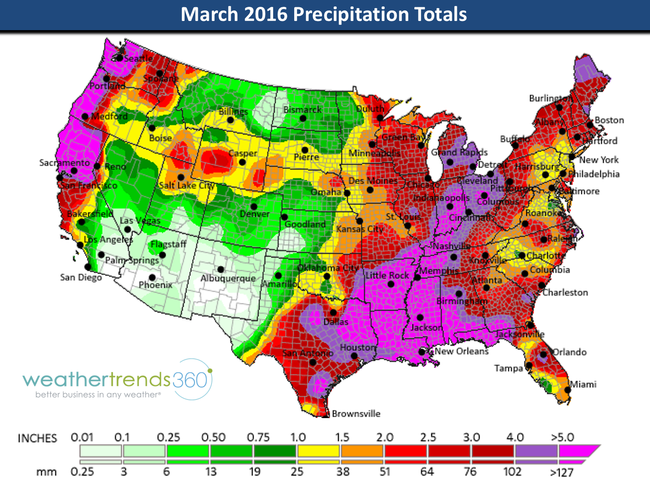
March"!
The National rainfall index as sampled across 260 cities shows the wettest conditions in 5 years after 3 very dry months the past few years.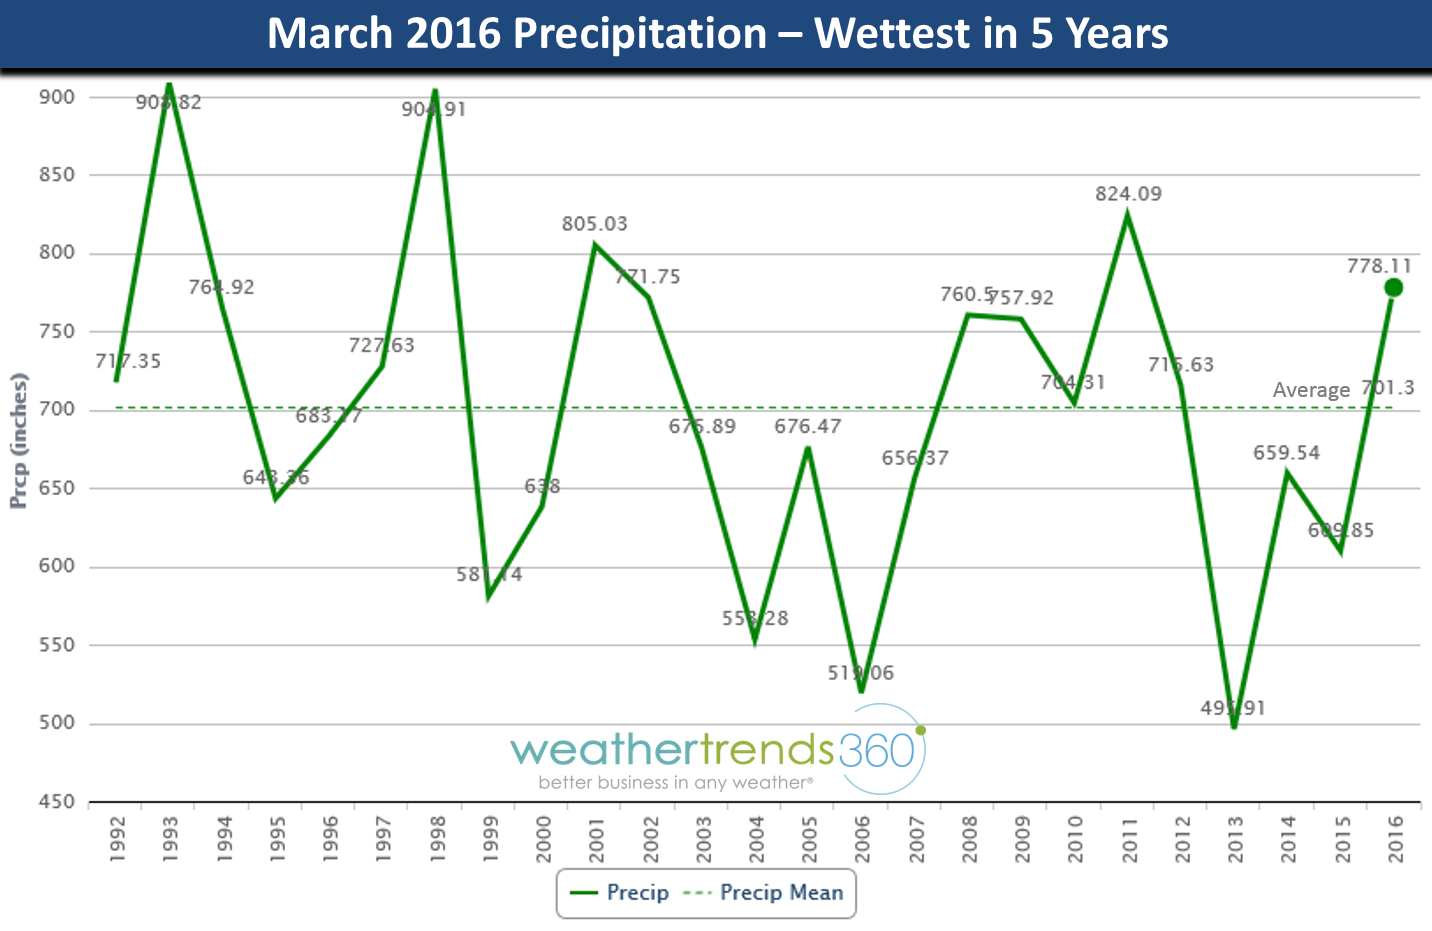
Snowfall was also on the sparse side trending the 3rd least in 25+ years for the U.S. overall but the Sierras, Central Rocky Mountains and Upper Midwest all did well with heavier snow despite the warmer weather.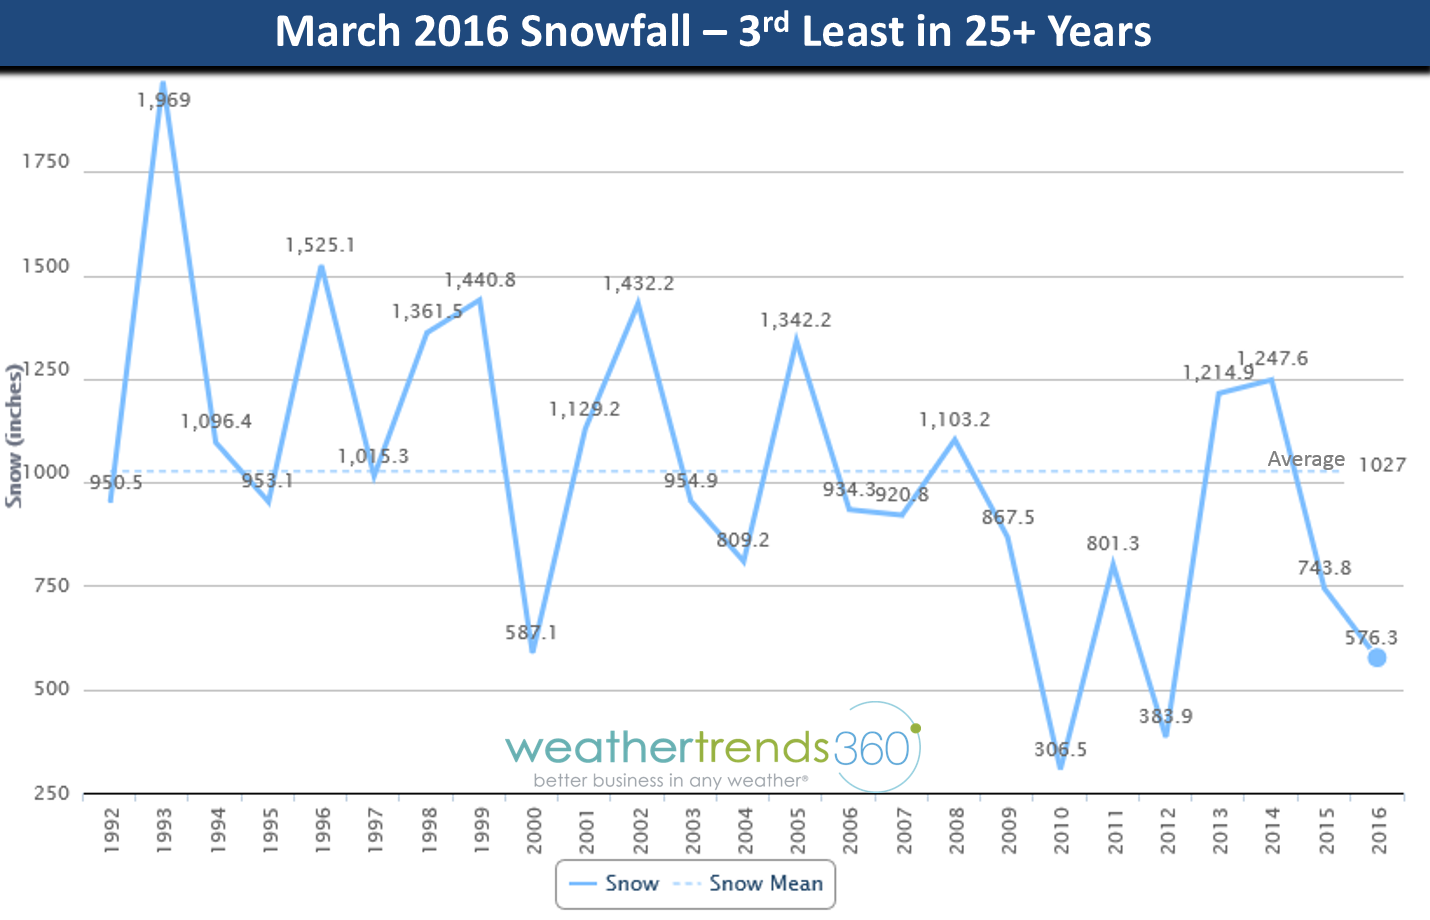
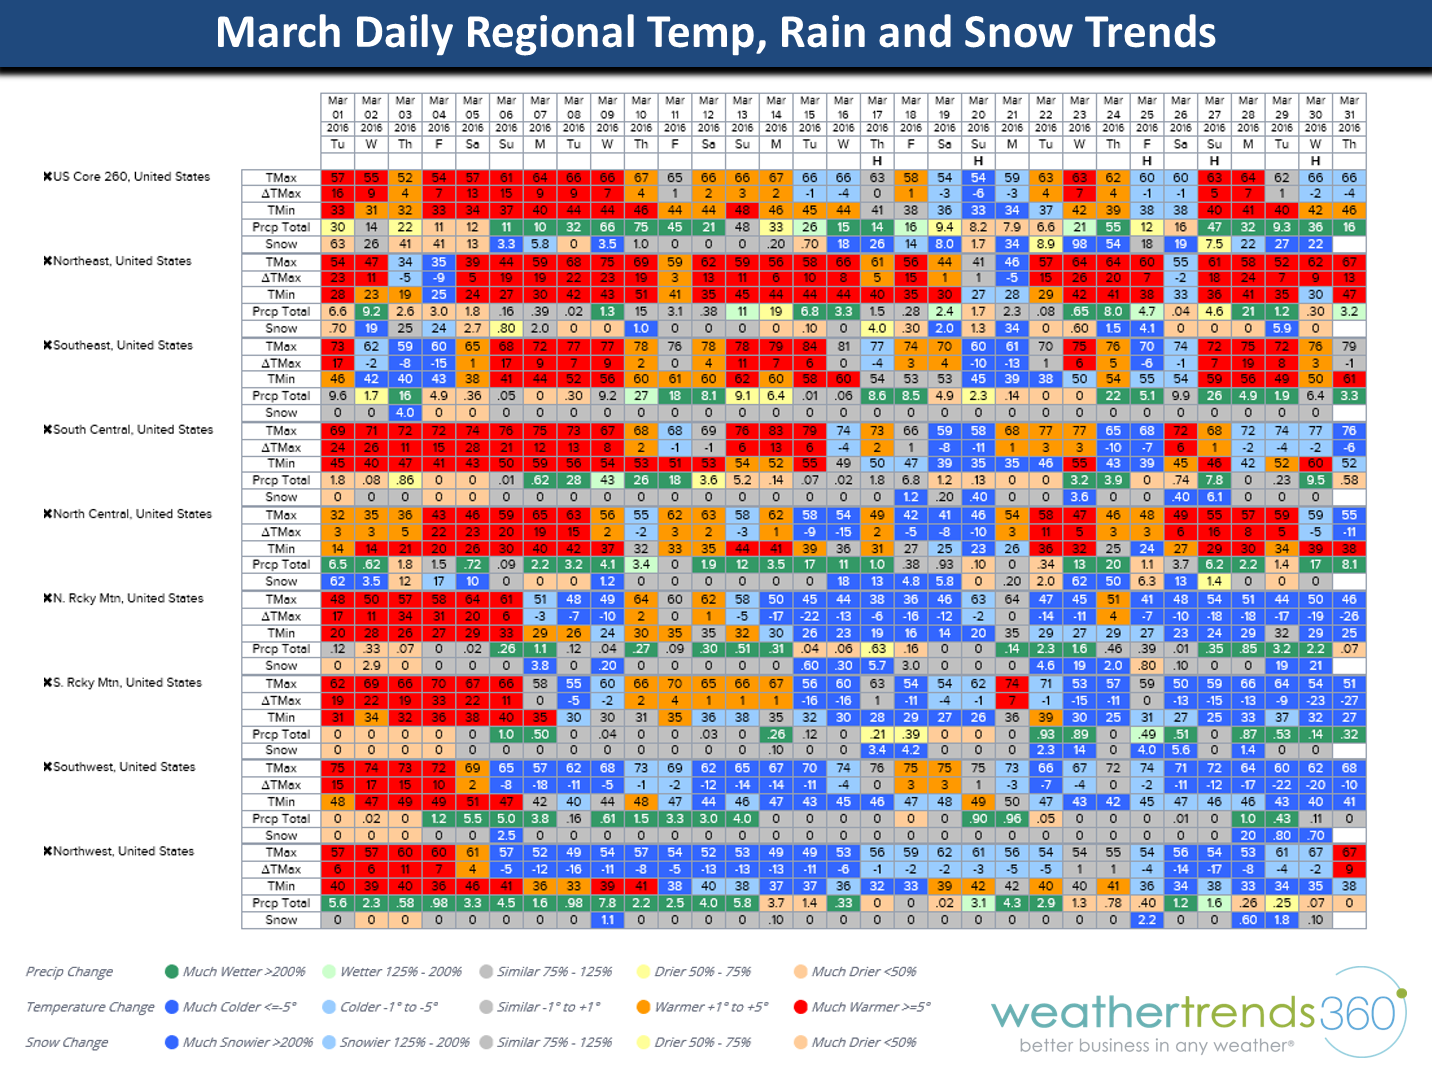
A day-by-day regional breakdown shows the extreme warmth early in the month where the Northeast had several temperatures up near 80 for record breaking warmth. The color coding in this table shows how the days trended from last year with the Western regions again showing the greatest change toward a colder March while the Northeast showed the greatest changes toward a much warmer March. CLICK FOR LARGER IMAGE
Nationally day-by-day it's easier to see the dramatically warmer start to the front half of March but less extremes later in the month. The bars show how national temperatures are trending vs last year so notice that April does look to be cooler than last year and coolest in 3 years for the U.S. as a whole and especially the Northeast.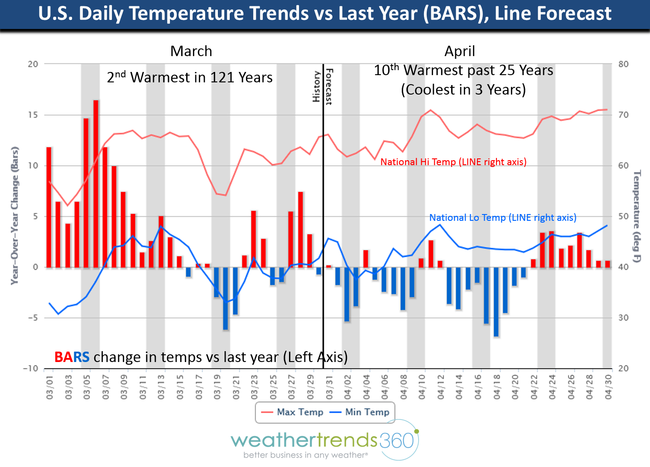
Weekly rainfall trends show the 2nd week in March was a soak'er but going into April the rainfall shouldn't be quite as extreme for the U.S. overall.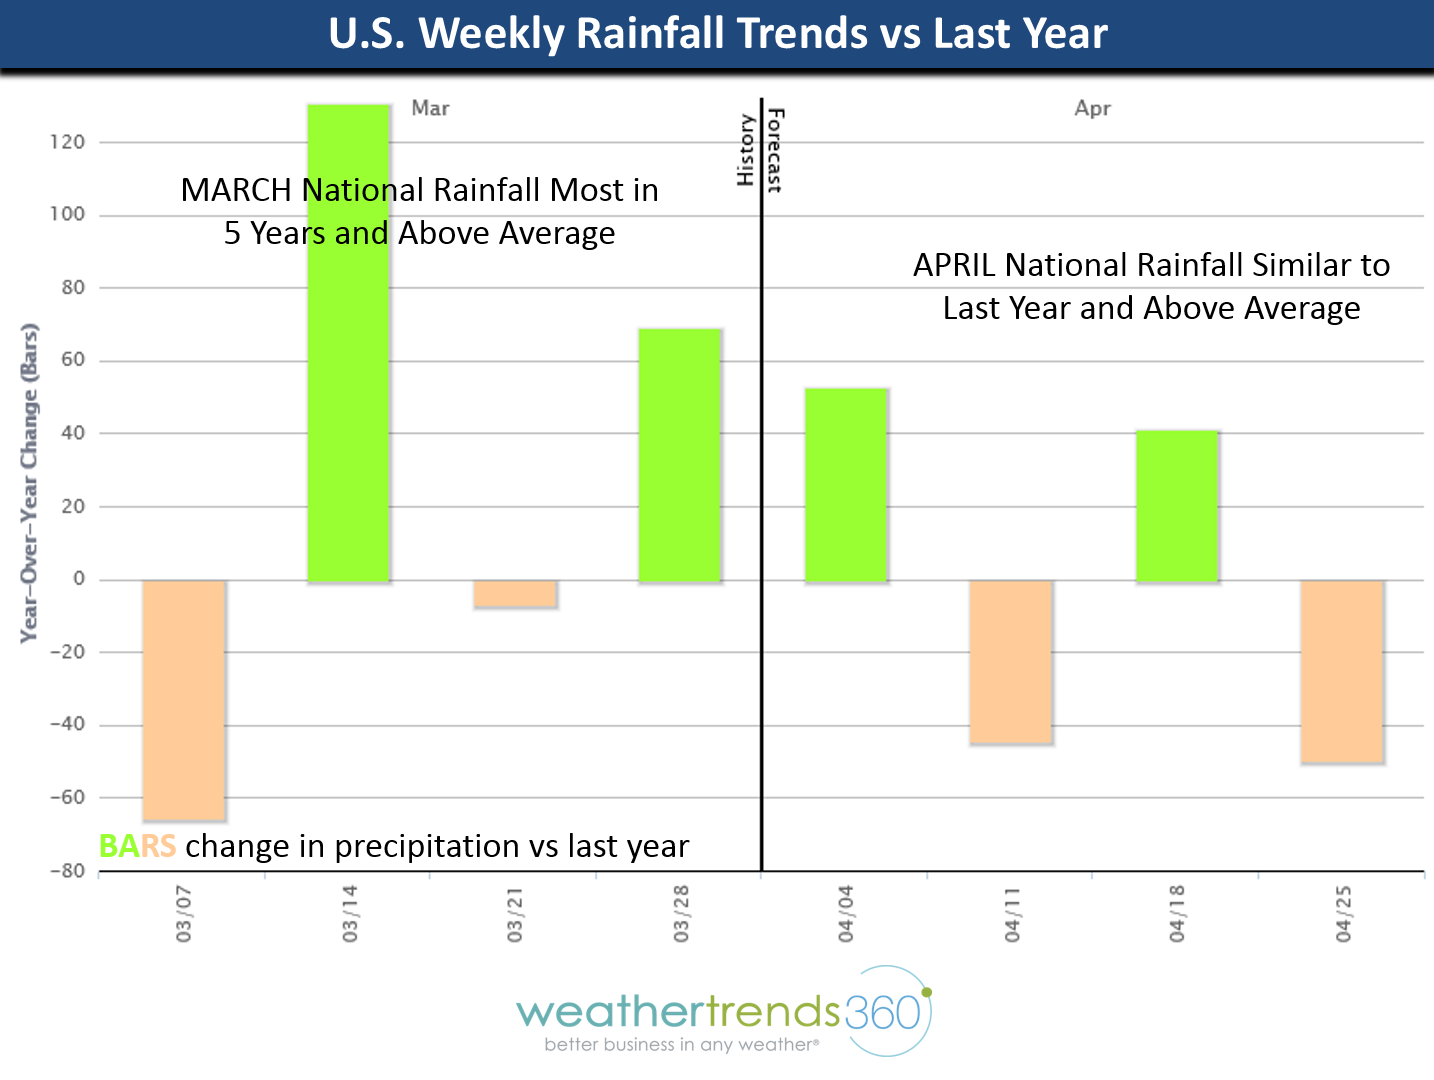
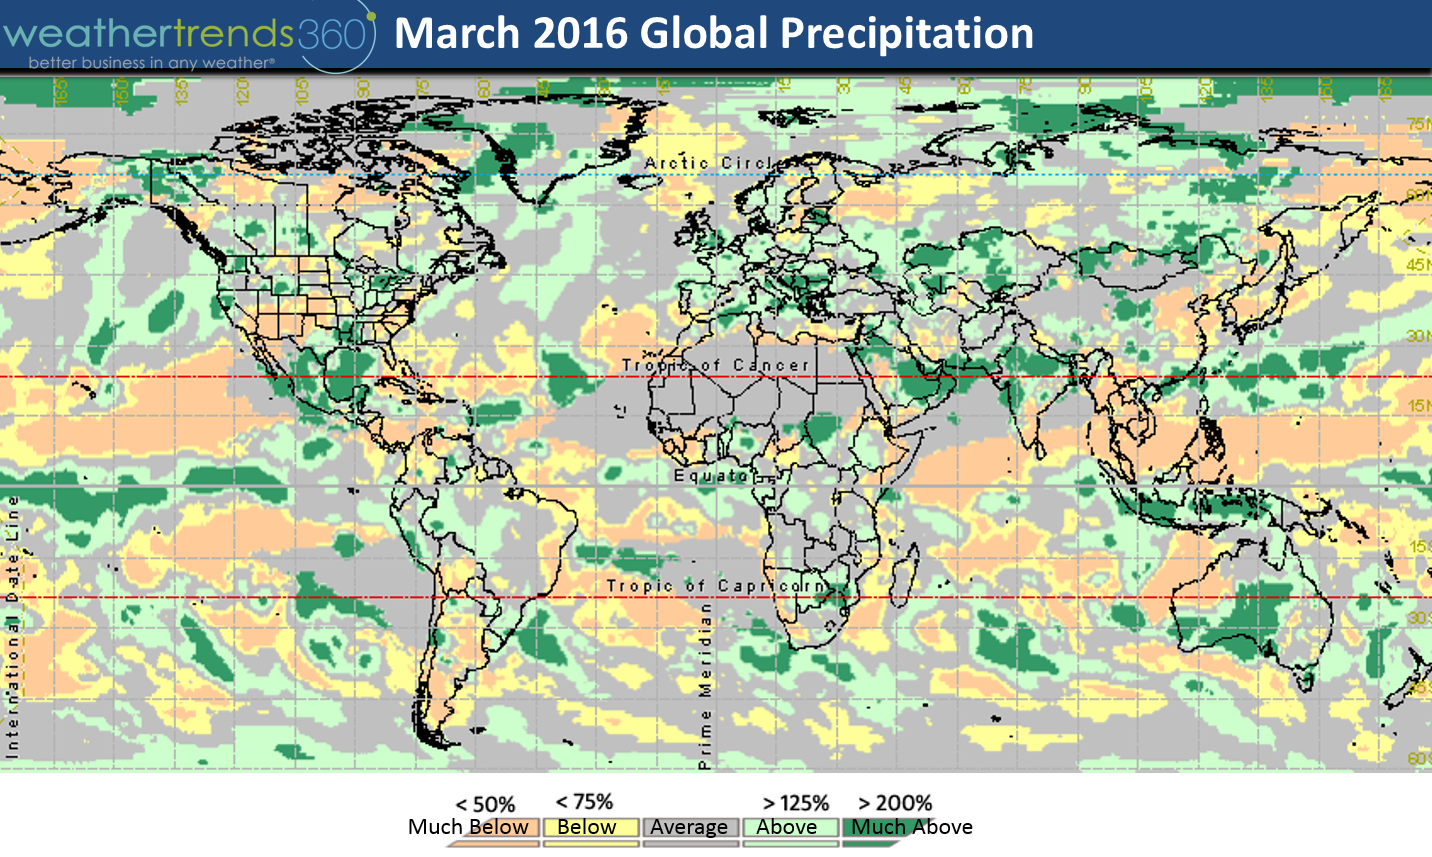
Globally March rainfall was heaviest in the South Central U.S. Northern Brazil Rainforest along the Equator into Indonesia. Some areas in Indonesia over to Papa New Guinea had over 30" of rain in March.
Hope you had a great month! - Capt Kirk out.
Compared to last year the greatest changes were in the Northeast while the West trended cooler year-over-year.
Max temperature trends for the U.S. as a whole show the dramatic change from the prior few years. 2016 was not as hot as 2012 but a close second.
Globally the cool spots were in Northeast Canada, Western Europe, Northwest Africa and Argentina.
Rainfall totals across the U.S. were heaviest down in Northeast Texas but a bulls-eye of epic rain totals over 16-20"+ in Northern Louisiana and Southeast Arkansas where there was major river flooding. North Central California was also a big winner with rainfall bringing most of the huge lake reservoirs above average and near capacity with a "Miracle

March"!
The National rainfall index as sampled across 260 cities shows the wettest conditions in 5 years after 3 very dry months the past few years.
Snowfall was also on the sparse side trending the 3rd least in 25+ years for the U.S. overall but the Sierras, Central Rocky Mountains and Upper Midwest all did well with heavier snow despite the warmer weather.
A day-by-day regional breakdown shows the extreme warmth early in the month where the Northeast had several temperatures up near 80 for record breaking warmth. The color coding in this table shows how the days trended from last year with the Western regions again showing the greatest change toward a colder March while the Northeast showed the greatest changes toward a much warmer March. CLICK FOR LARGER IMAGE
Nationally day-by-day it's easier to see the dramatically warmer start to the front half of March but less extremes later in the month. The bars show how national temperatures are trending vs last year so notice that April does look to be cooler than last year and coolest in 3 years for the U.S. as a whole and especially the Northeast.

Weekly rainfall trends show the 2nd week in March was a soak'er but going into April the rainfall shouldn't be quite as extreme for the U.S. overall.
Globally March rainfall was heaviest in the South Central U.S. Northern Brazil Rainforest along the Equator into Indonesia. Some areas in Indonesia over to Papa New Guinea had over 30" of rain in March.
Hope you had a great month! - Capt Kirk out.