Star Date: 21 July 2016 Thursday
Captain's Log
We can see the weekend from here. :)
This 3rd week of July is trending the 2nd hottest in 121 years, 2nd only to 2011, and the driest in 28 years for the nation as a whole. The extreme heat in the Central U.S. is bringing near 100F temperatures across a large area but along with insanely humid conditions as well. Blame all that corn sucking the moisture out of the ground and putting it in the air. This is keeping night time temperatures near 80F with upper 70 to low 80 dew points - unbearable. This heat will shift to the East Coasttomorrow with 95F to 100Fblistering hot temperatures by Northeast standards and it's a prolonged couple week pattern of temps above 90F so a lot of suffering as we're just not used to heat for this long in the Northeast. It could be worse, in Baghdad lows are 98F high 122F but it's a dry heat with 5% humidity making it an oven vs our sauna. The most comfortable spot in the country escaping the heat is the Pacific Northwest and the wettest spot is the Upper Plains.
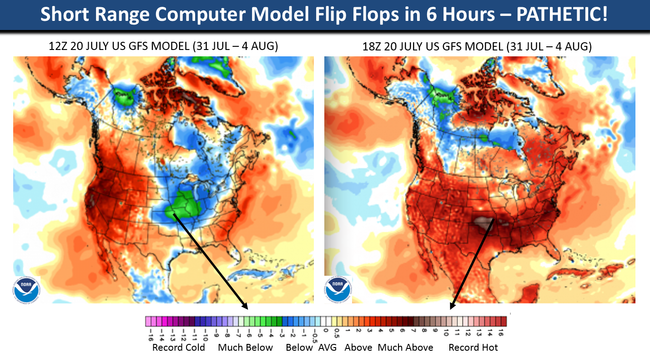
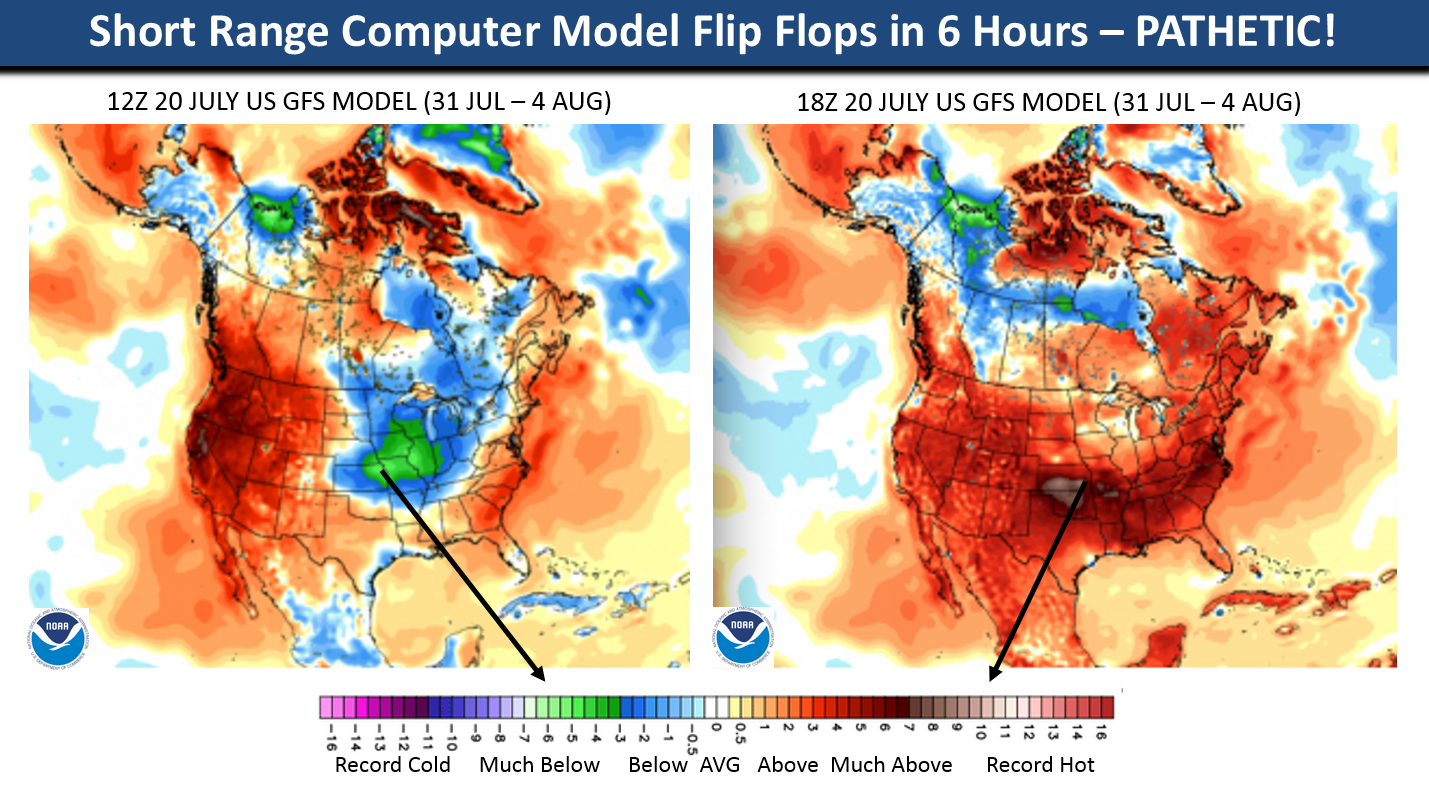
The last week of July (25th-31st) remains the hottest since 1999 for the U.S. overall but also the wettest in 7 years. Very unusual to have such hot weather and stormy weather too so expect the humidity to again be unbearable for much of the country. The heat really never leaves the East Coast but it will rebuild in the Central U.S. as we go into early August. Models have backed off the excessively wet conditions but still bring some rain from the Midwest to the Middle Atlantic only adding to the humidity levels. Not a fan of short range computer models right now as they are about as trustworthy as a politician! ;) Example below shows it was going to be an epic cold star to August and then 6 hours later epic hot. They're not handling the Pacific Hurricanes well so take them with a grain of salt beyond a week.
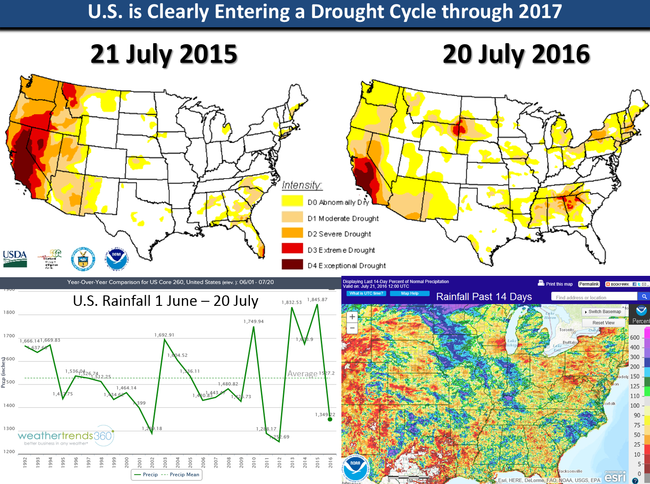
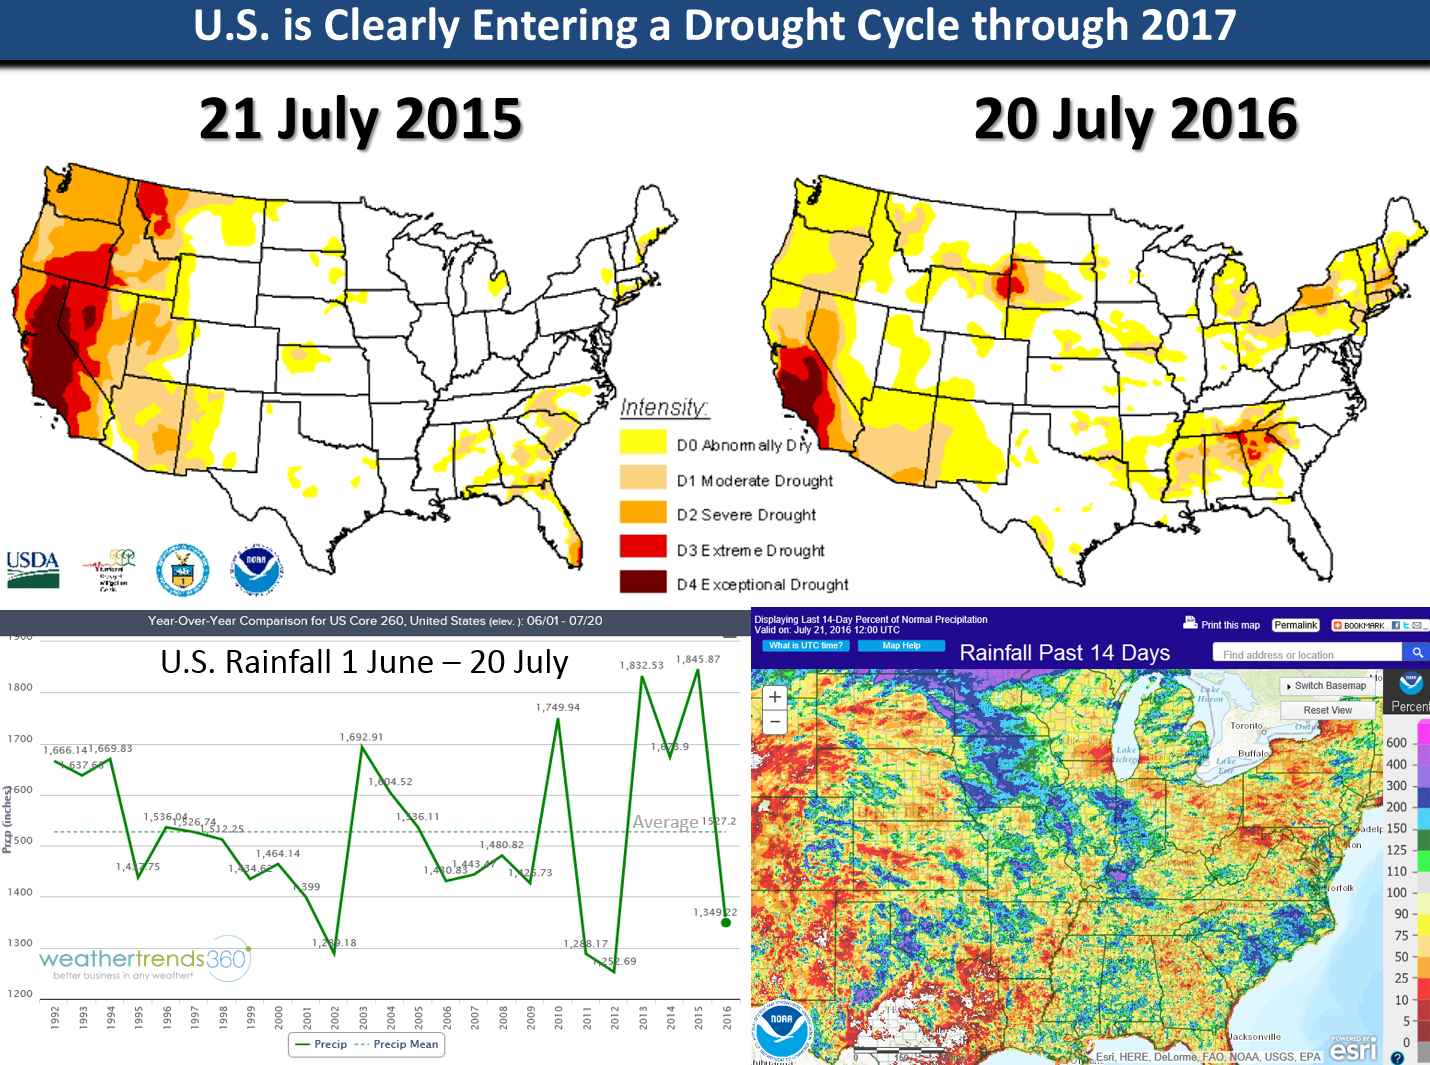
Texas remains bone dry and is very likely in the early stages of a building drought, even though not much shows up on the NOAA drought monitor yet. Summer to date has a made a wholesale change from the past few Summers that were exceptionally wet for the U.S. as a whole. Clearly we're in the early stages of a building 2-year La Nina, +PDO, +AMO drought cycle like 2011-2012.
We're getting close to the period in the season where the Atlantic Ocean can whip up a hurricane very quickly and this year is particularly threatening. NOAA has indicated the Tropical Cyclone Heat Potential (TCHP) is at levels not seen since the record breaking 2005 hurricane season. Basically the water temperatures are exceedingly warm with a lot of other favorable factors, no El Nino wind shear, wet Sub-Sahara Africa so a favorable environment as we get into the middle August - October time-frame.
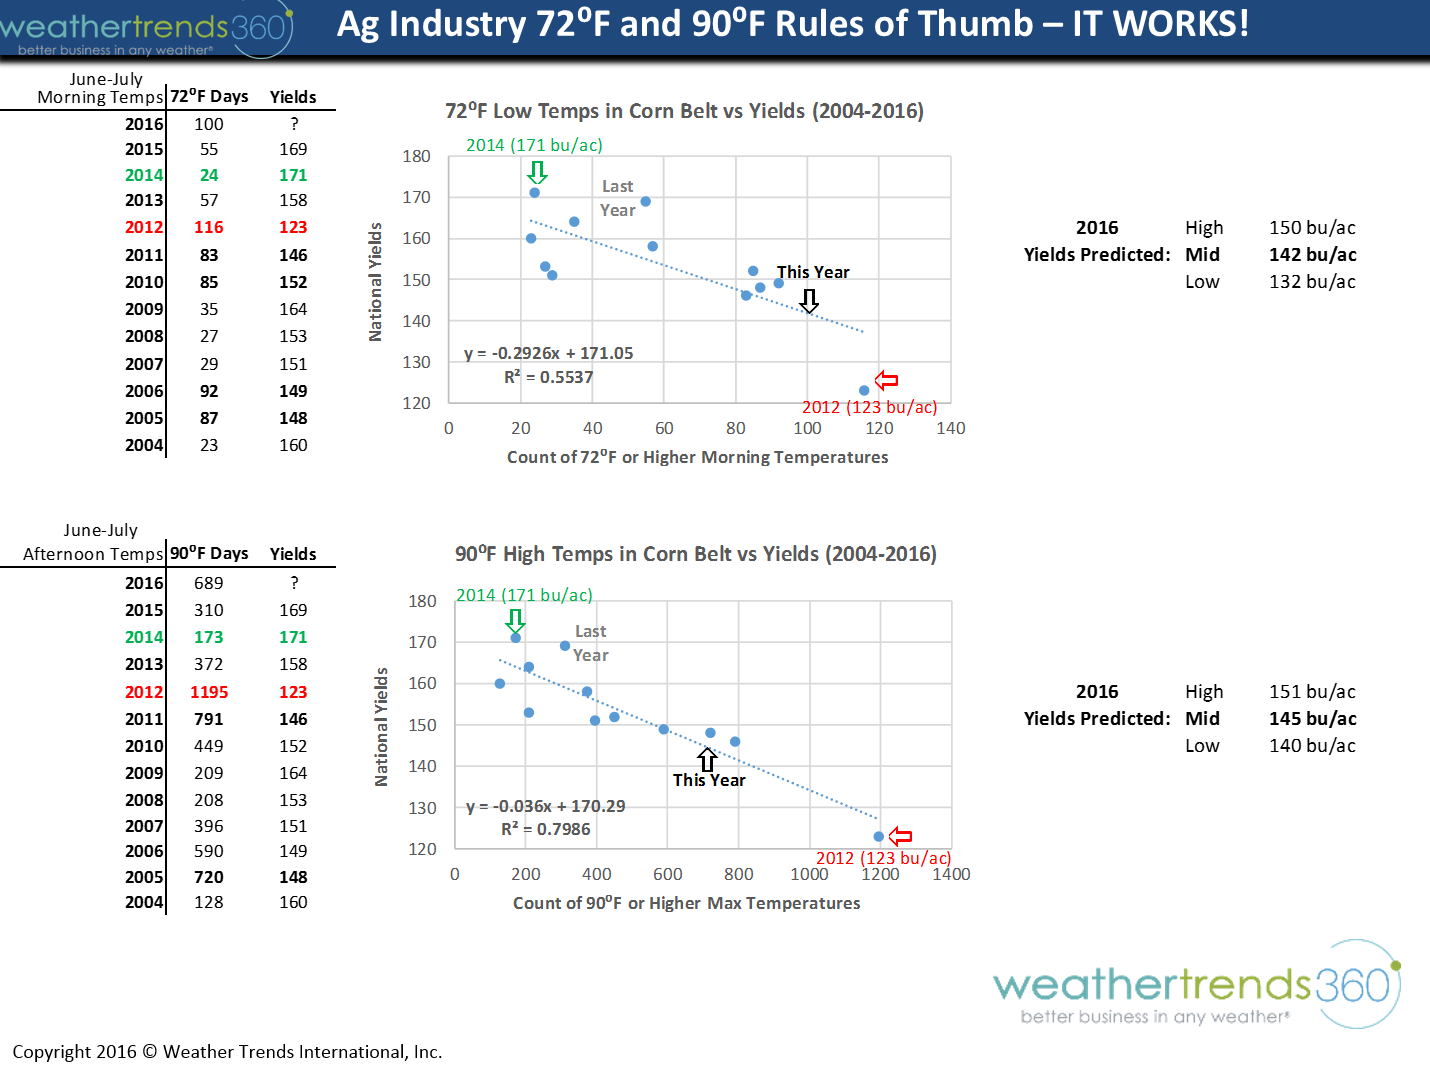
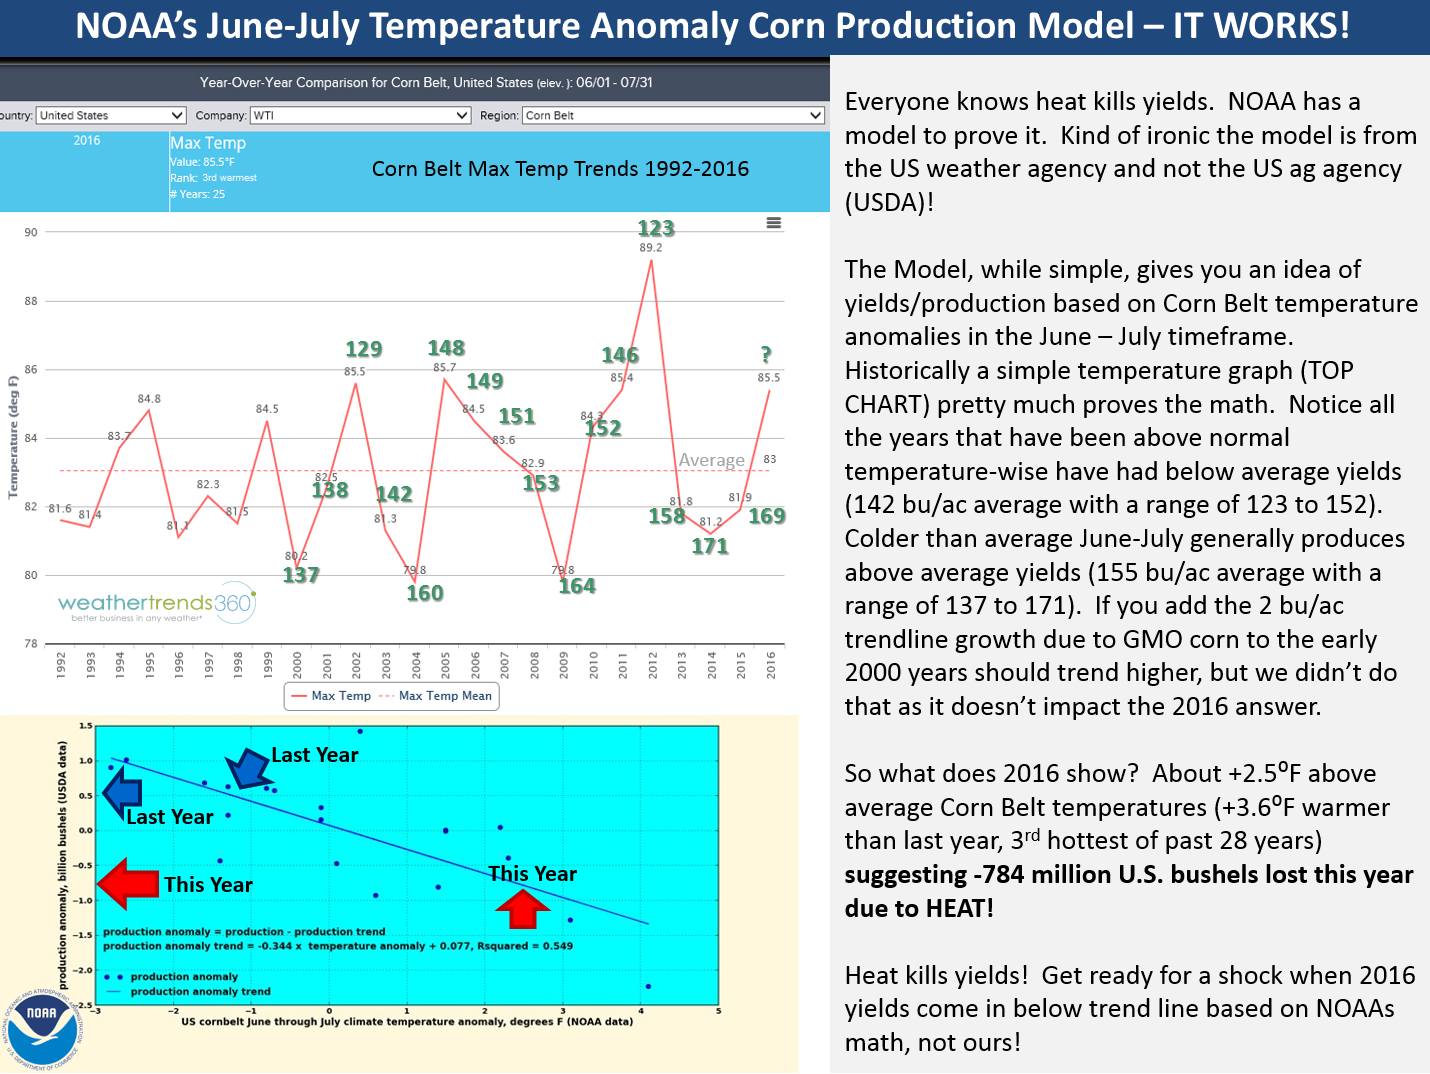
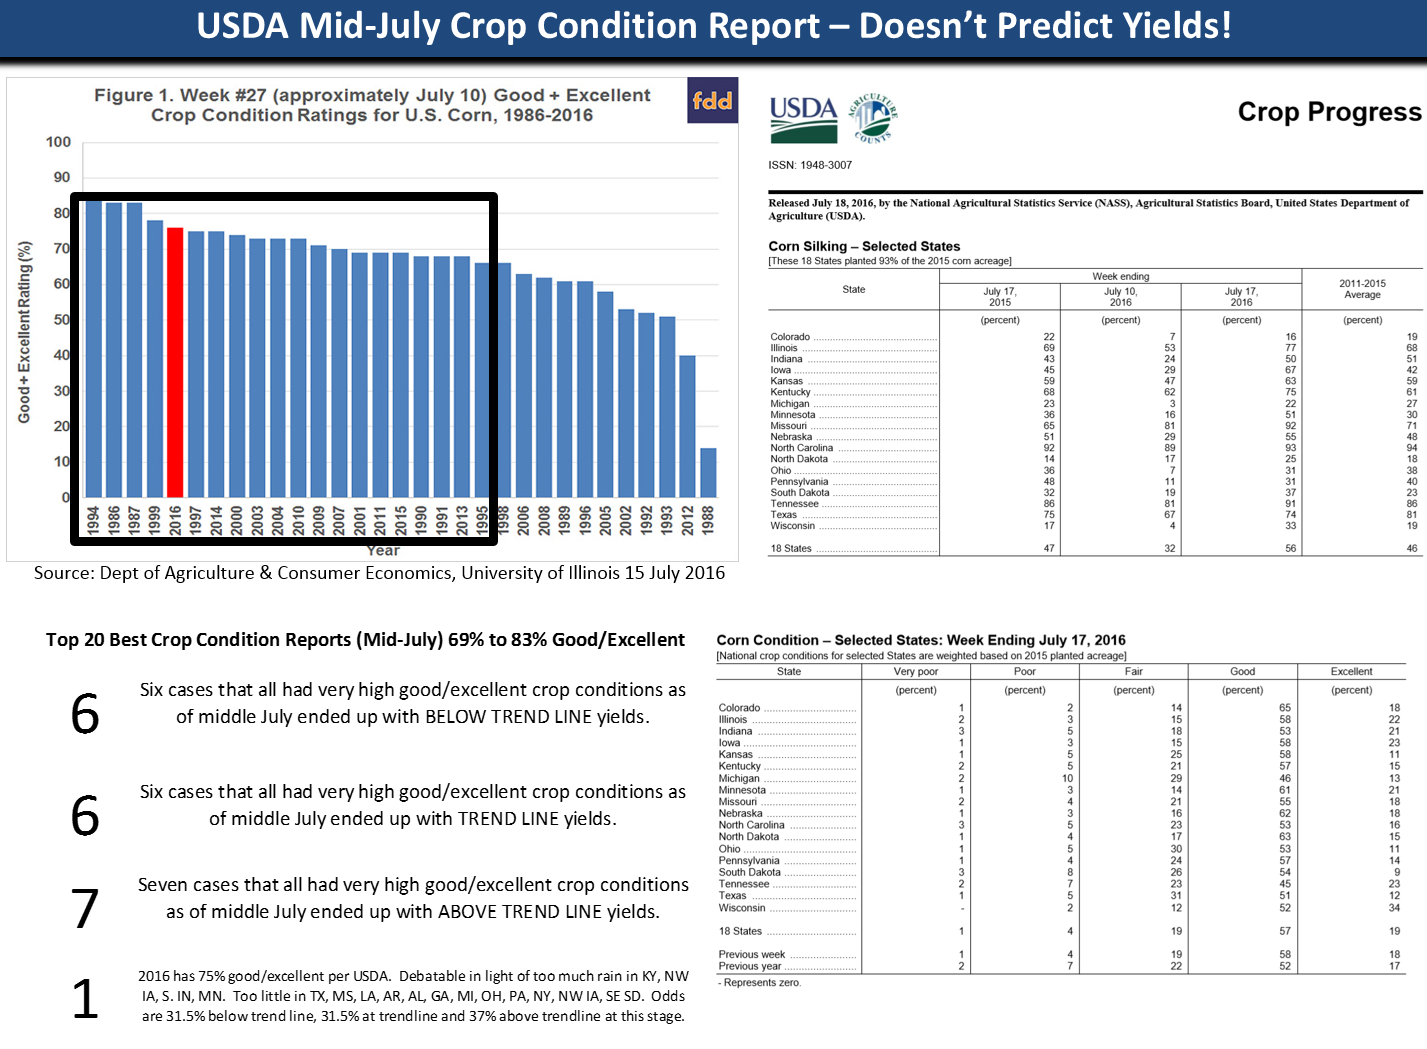
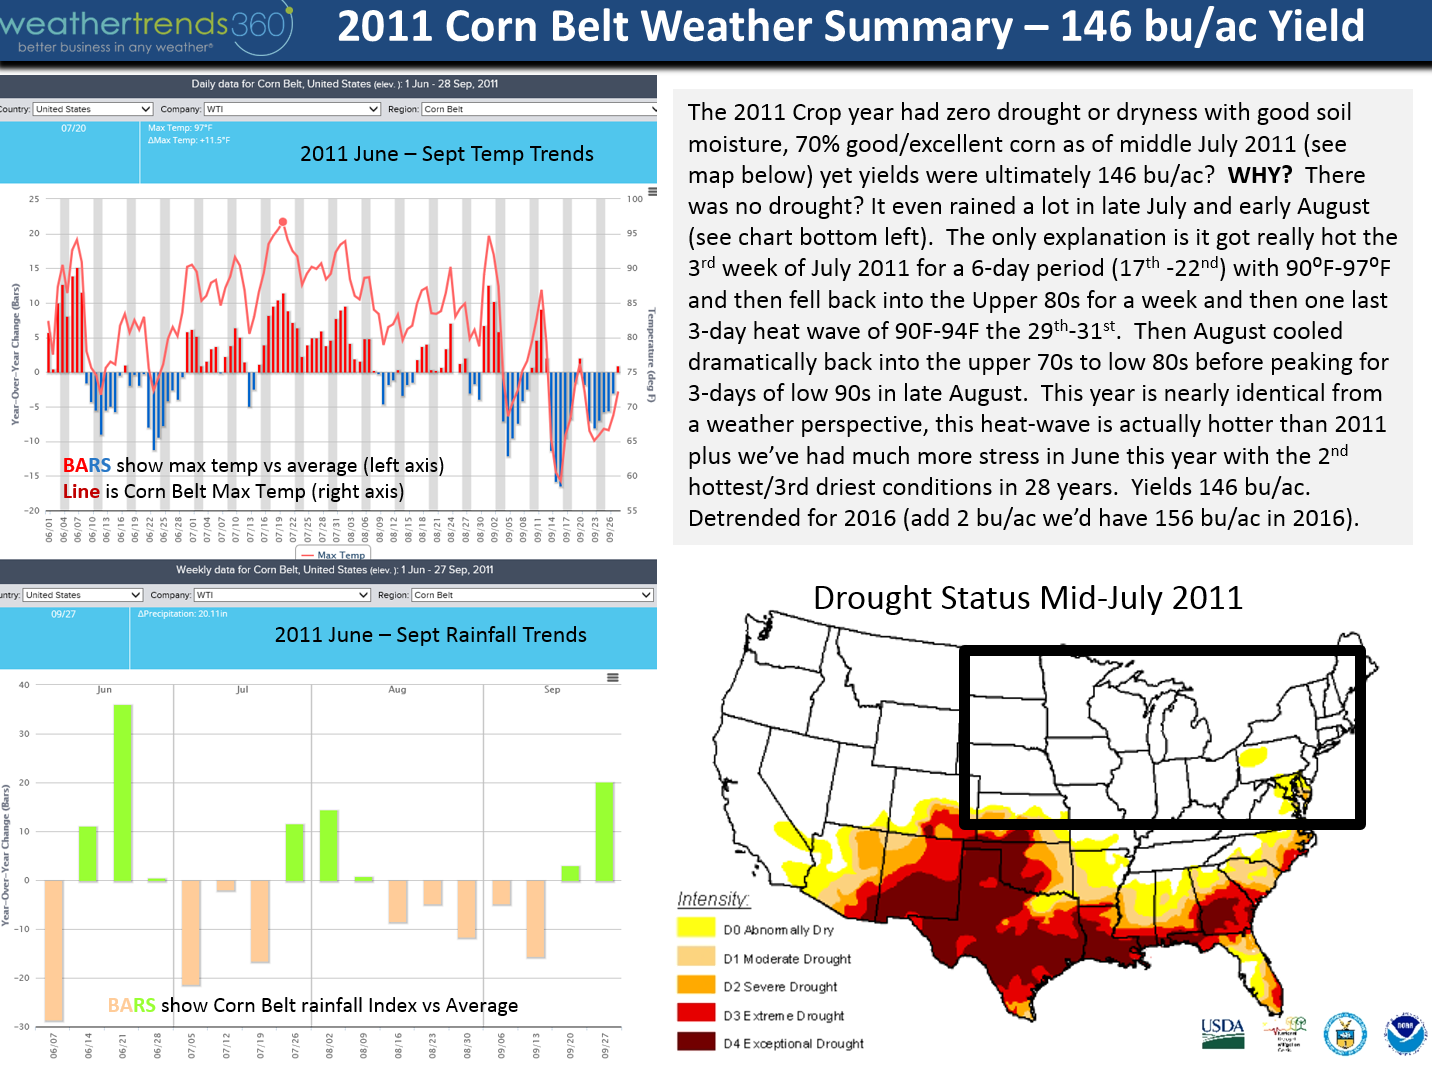
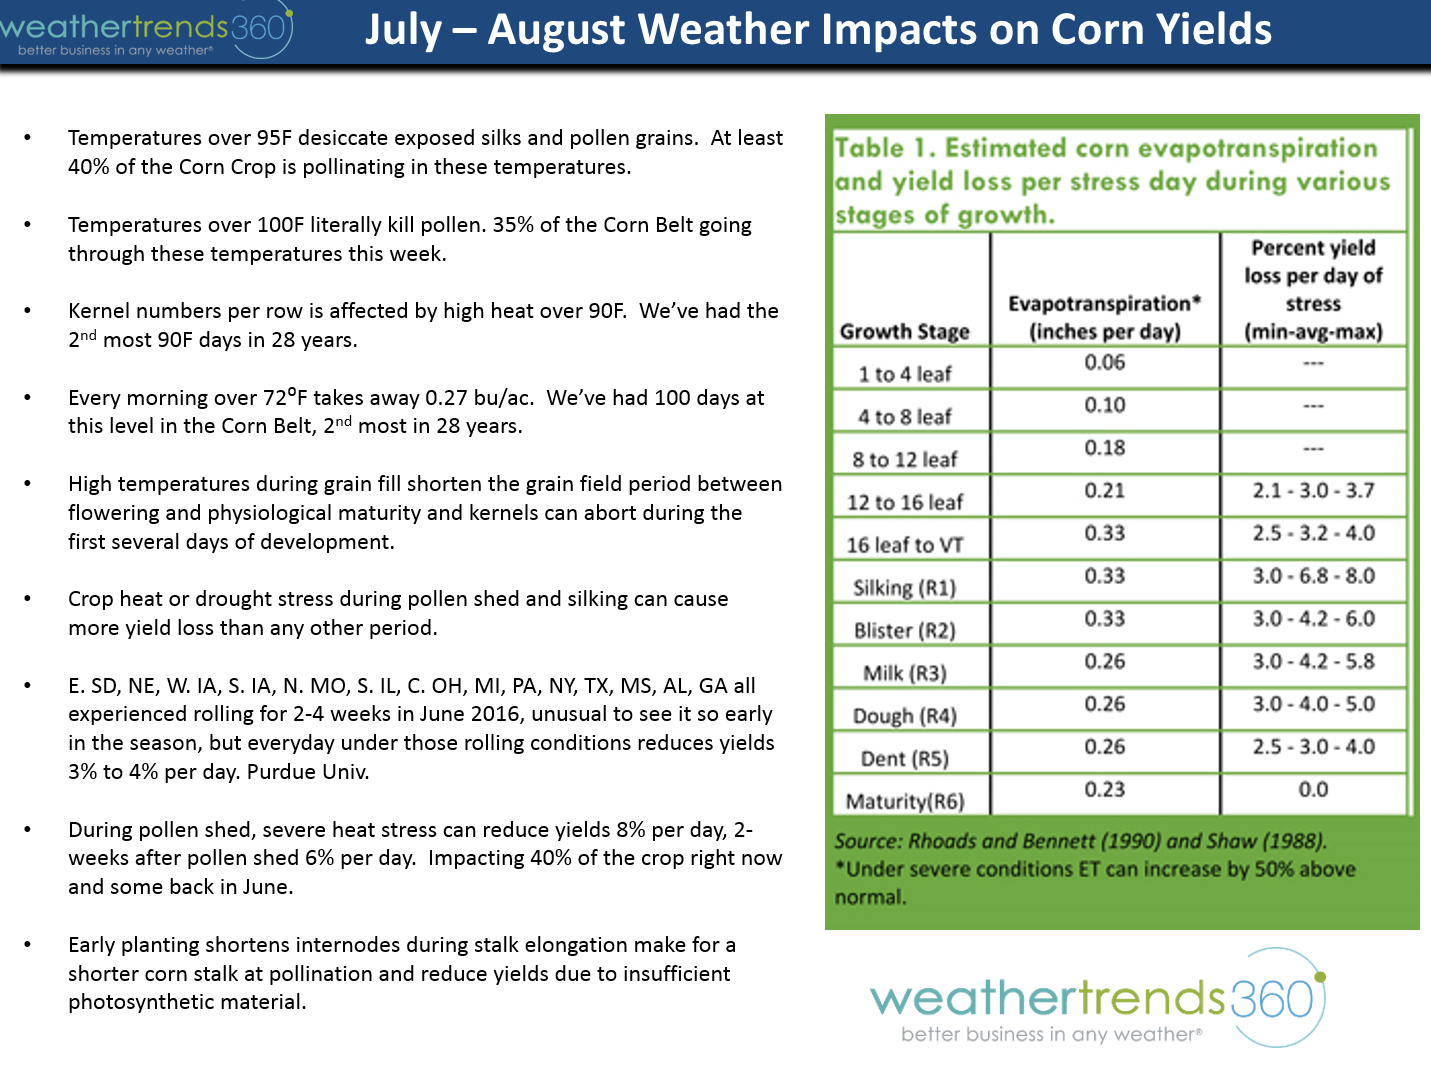
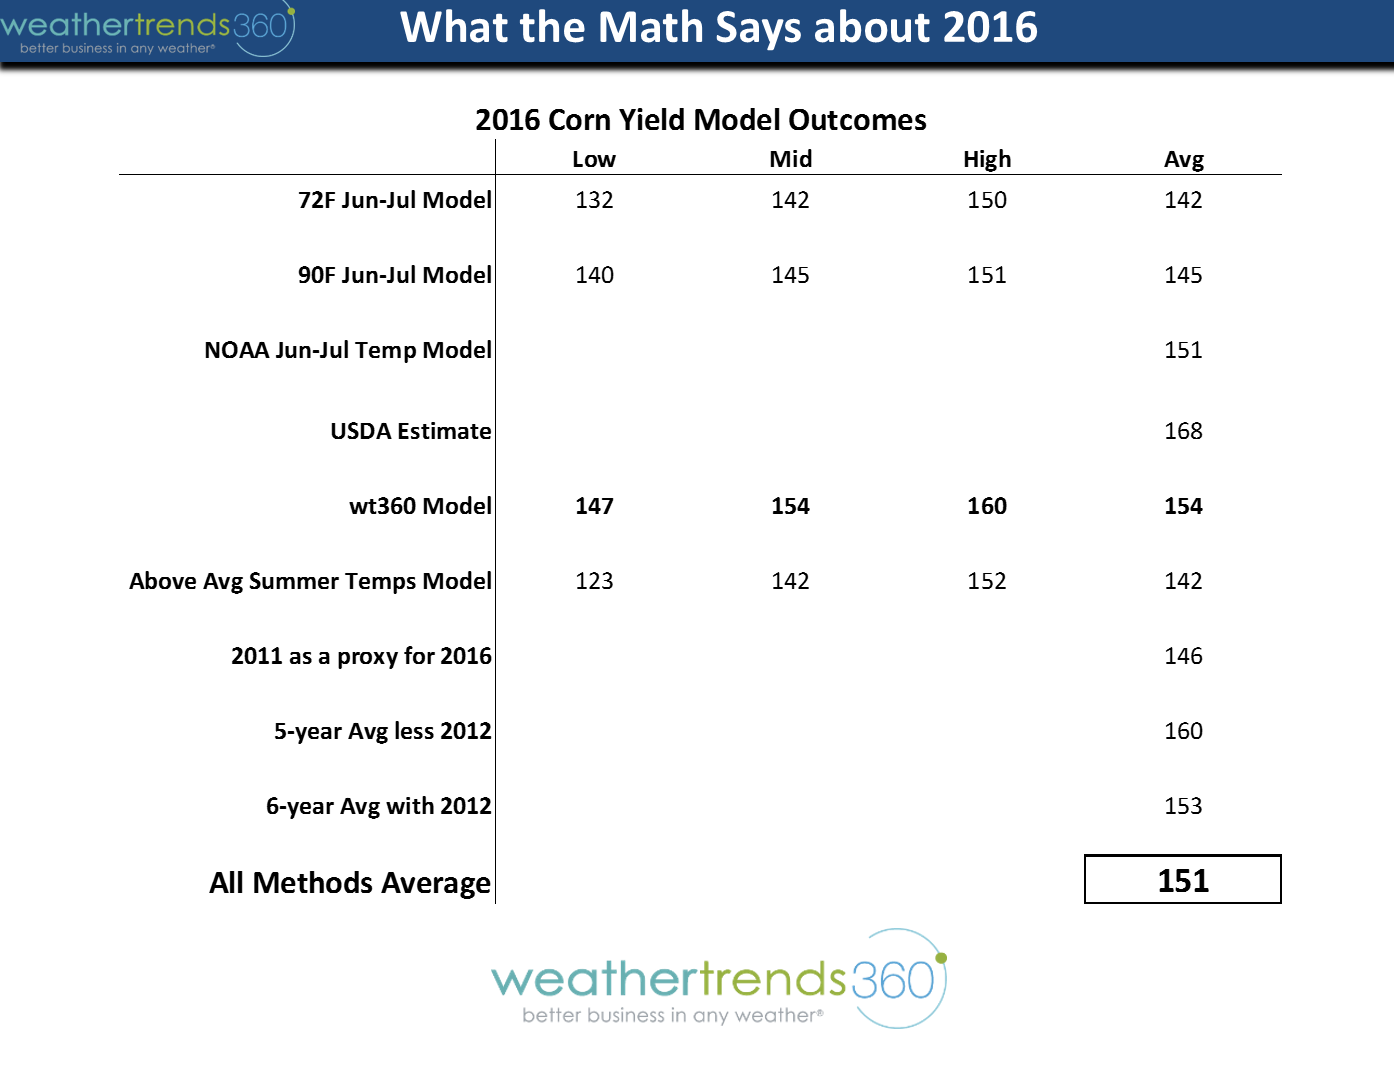
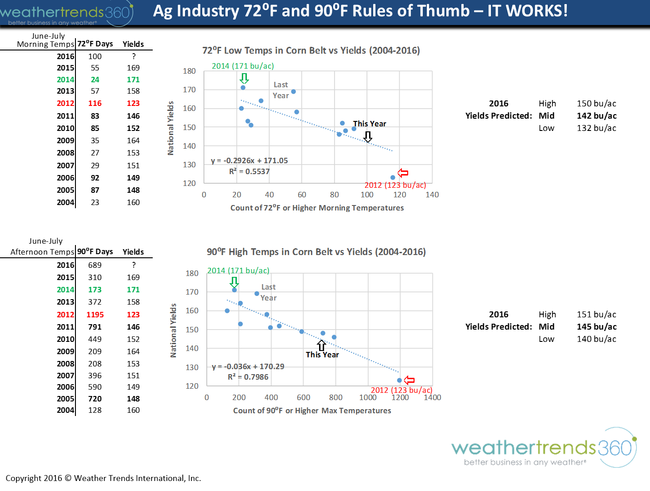
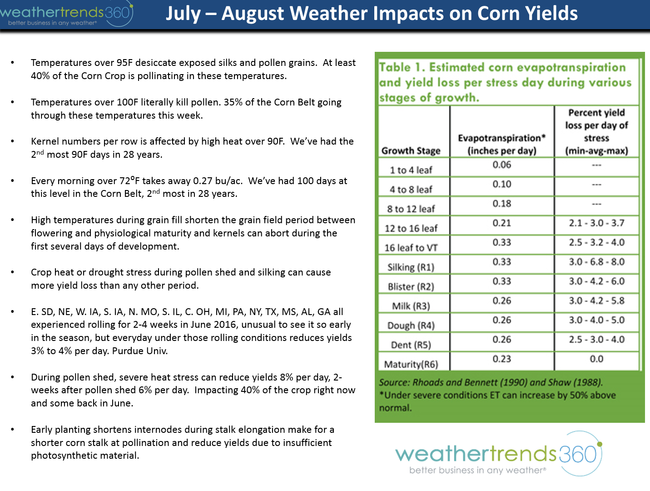
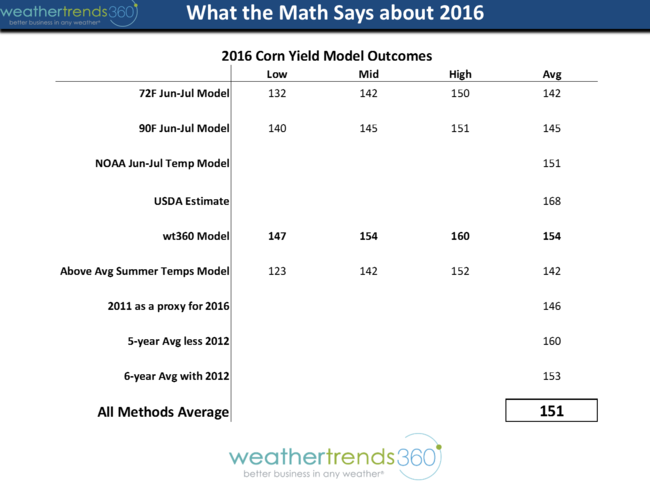
For our farmer friends that aren't clients, we sent out some detailed analysis yesterday explaining why heat kills yields and how these rosy USDA outlooks in mid-July don't tell you much. Below are some of the slides sent to clients trying to bring sanity as clearly CBOT, Wall Street paper farmers think we have way too much corn already and you'll produce 175 bu/ac record shattering crop. Not true as history tells us otherwise and we even have 2011 as a real world weather example to show how everyone can be surprised by heat and it's impact on yields - no one saw the 146 bu/ac 2011 yield and the parallels to 2016 here in July and August are very similar. Heat kills yields - study the 2011 example closely and you'll see it was only a 6-day heat wave this exact week 5 years ago, then cooled off, then a minor 3-day heat wave with above normal rain in late July and early August followed by 70s mid month before one last minor heat-wave late month. Don't compare prices, but if we have anything shy of 160 bu/ac markets will eventually wake up. THE INFORMATION BELOW IS COPYRIGHT PROTECTED.


This 3rd week of July is trending the 2nd hottest in 121 years, 2nd only to 2011, and the driest in 28 years for the nation as a whole. The extreme heat in the Central U.S. is bringing near 100F temperatures across a large area but along with insanely humid conditions as well. Blame all that corn sucking the moisture out of the ground and putting it in the air. This is keeping night time temperatures near 80F with upper 70 to low 80 dew points - unbearable. This heat will shift to the East Coasttomorrow with 95F to 100Fblistering hot temperatures by Northeast standards and it's a prolonged couple week pattern of temps above 90F so a lot of suffering as we're just not used to heat for this long in the Northeast. It could be worse, in Baghdad lows are 98F high 122F but it's a dry heat with 5% humidity making it an oven vs our sauna. The most comfortable spot in the country escaping the heat is the Pacific Northwest and the wettest spot is the Upper Plains.
The last week of July (25th-31st) remains the hottest since 1999 for the U.S. overall but also the wettest in 7 years. Very unusual to have such hot weather and stormy weather too so expect the humidity to again be unbearable for much of the country. The heat really never leaves the East Coast but it will rebuild in the Central U.S. as we go into early August. Models have backed off the excessively wet conditions but still bring some rain from the Midwest to the Middle Atlantic only adding to the humidity levels. Not a fan of short range computer models right now as they are about as trustworthy as a politician! ;) Example below shows it was going to be an epic cold star to August and then 6 hours later epic hot. They're not handling the Pacific Hurricanes well so take them with a grain of salt beyond a week.
Texas remains bone dry and is very likely in the early stages of a building drought, even though not much shows up on the NOAA drought monitor yet. Summer to date has a made a wholesale change from the past few Summers that were exceptionally wet for the U.S. as a whole. Clearly we're in the early stages of a building 2-year La Nina, +PDO, +AMO drought cycle like 2011-2012.
We're getting close to the period in the season where the Atlantic Ocean can whip up a hurricane very quickly and this year is particularly threatening. NOAA has indicated the Tropical Cyclone Heat Potential (TCHP) is at levels not seen since the record breaking 2005 hurricane season. Basically the water temperatures are exceedingly warm with a lot of other favorable factors, no El Nino wind shear, wet Sub-Sahara Africa so a favorable environment as we get into the middle August - October time-frame.
For our farmer friends that aren't clients, we sent out some detailed analysis yesterday explaining why heat kills yields and how these rosy USDA outlooks in mid-July don't tell you much. Below are some of the slides sent to clients trying to bring sanity as clearly CBOT, Wall Street paper farmers think we have way too much corn already and you'll produce 175 bu/ac record shattering crop. Not true as history tells us otherwise and we even have 2011 as a real world weather example to show how everyone can be surprised by heat and it's impact on yields - no one saw the 146 bu/ac 2011 yield and the parallels to 2016 here in July and August are very similar. Heat kills yields - study the 2011 example closely and you'll see it was only a 6-day heat wave this exact week 5 years ago, then cooled off, then a minor 3-day heat wave with above normal rain in late July and early August followed by 70s mid month before one last minor heat-wave late month. Don't compare prices, but if we have anything shy of 160 bu/ac markets will eventually wake up. THE INFORMATION BELOW IS COPYRIGHT PROTECTED.