U.S. Corn Yields About to Plummet Like 2011
Business
Here we go again! Strap in!
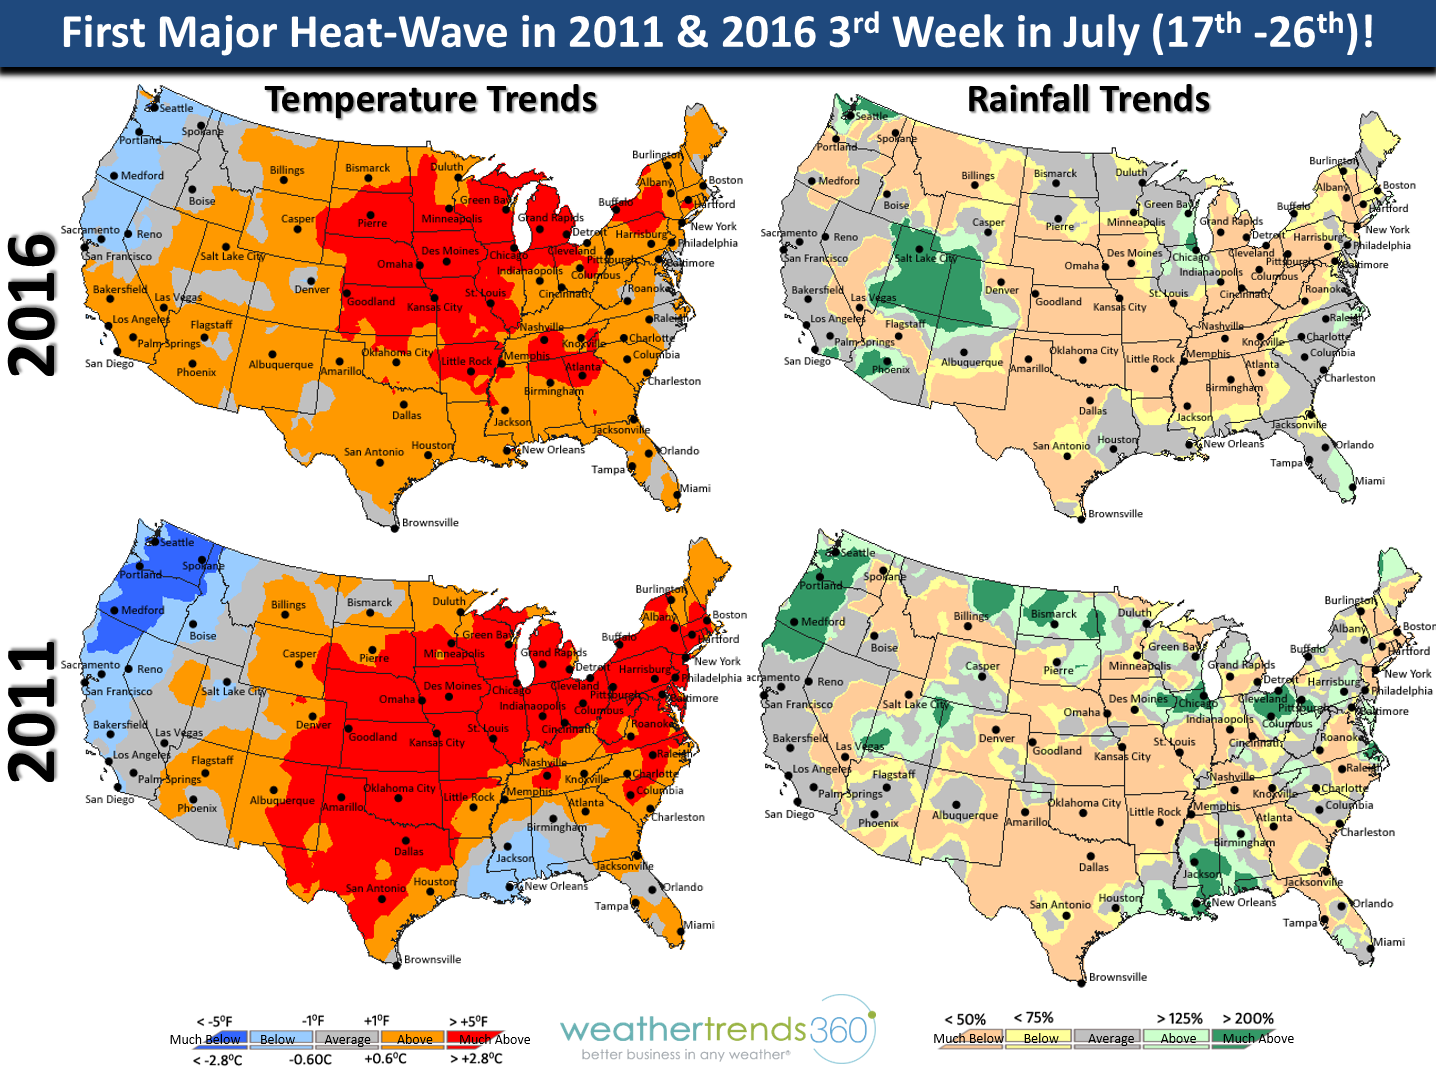
Everything was humming along in the U.S. Corn Belt in middle July 2011 up until the 3rd week of July when a major heat-wave and dry spell hit much of the Eastern half of the U.S. and the U.S. Corn Belt. Let's compare 2016 with 2011.
First, let's compare meteorological Summer 1 June - 13 July here in 2016 compared to the same period in 2011. Eerily similar only this Summer has been hotter/drier than 2011 so far, except in Texas.
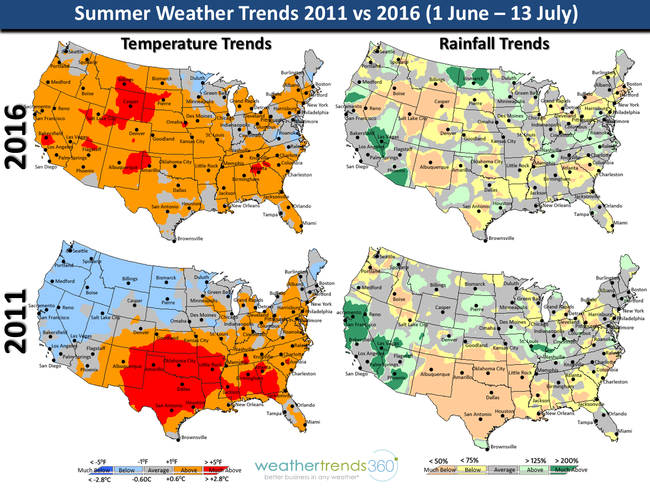
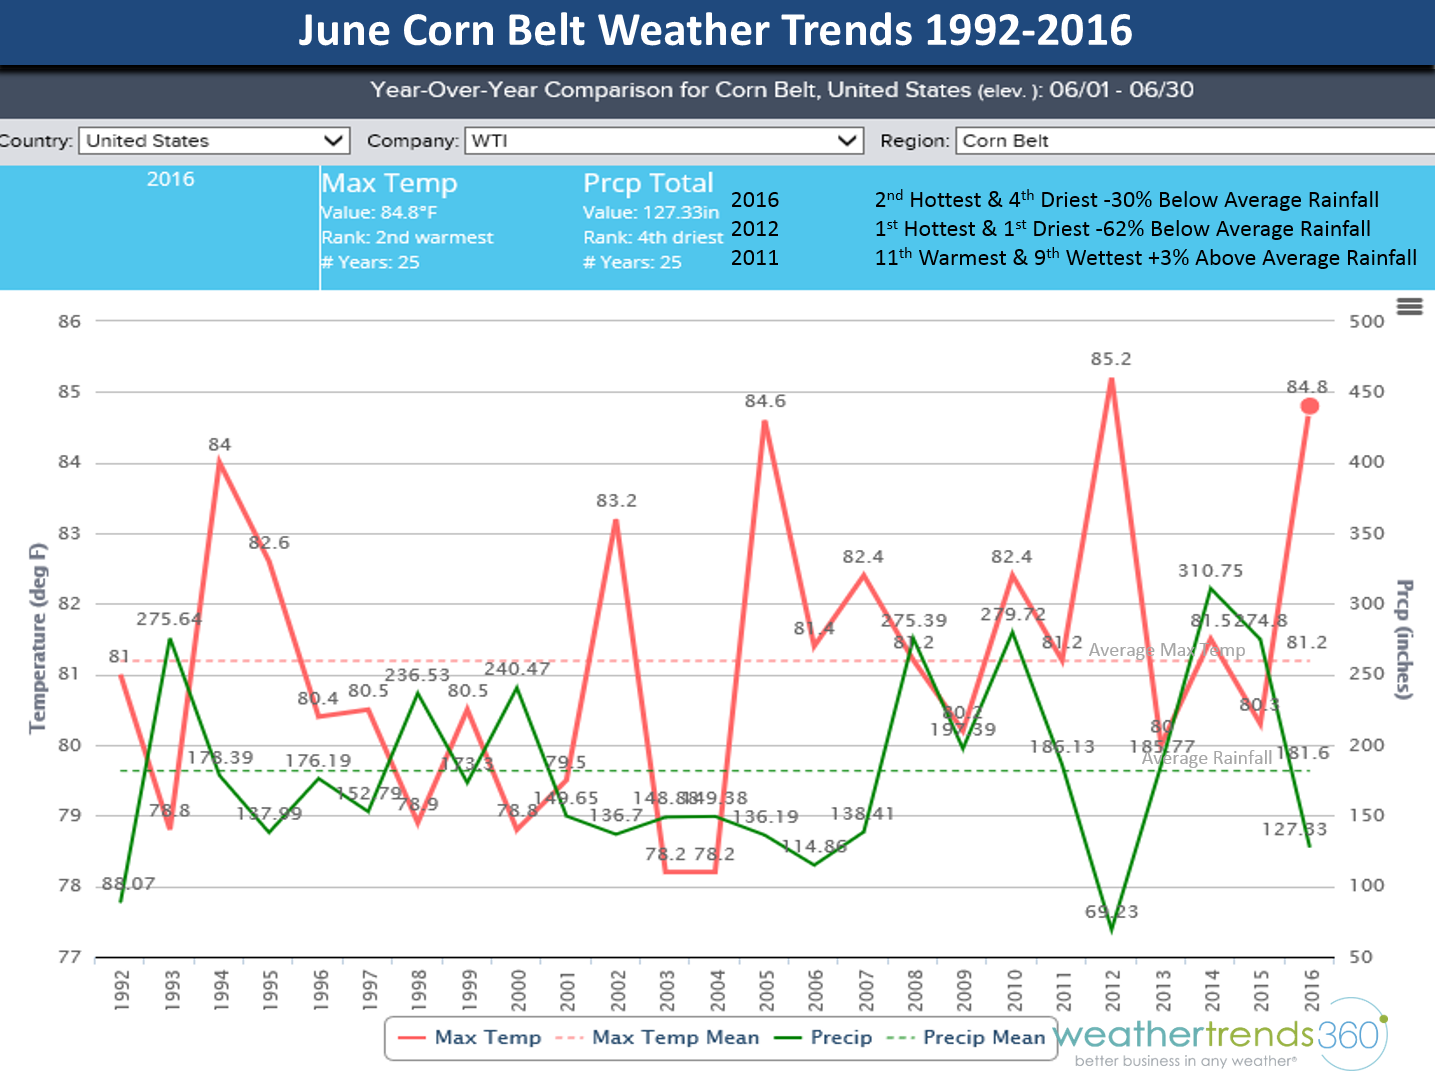
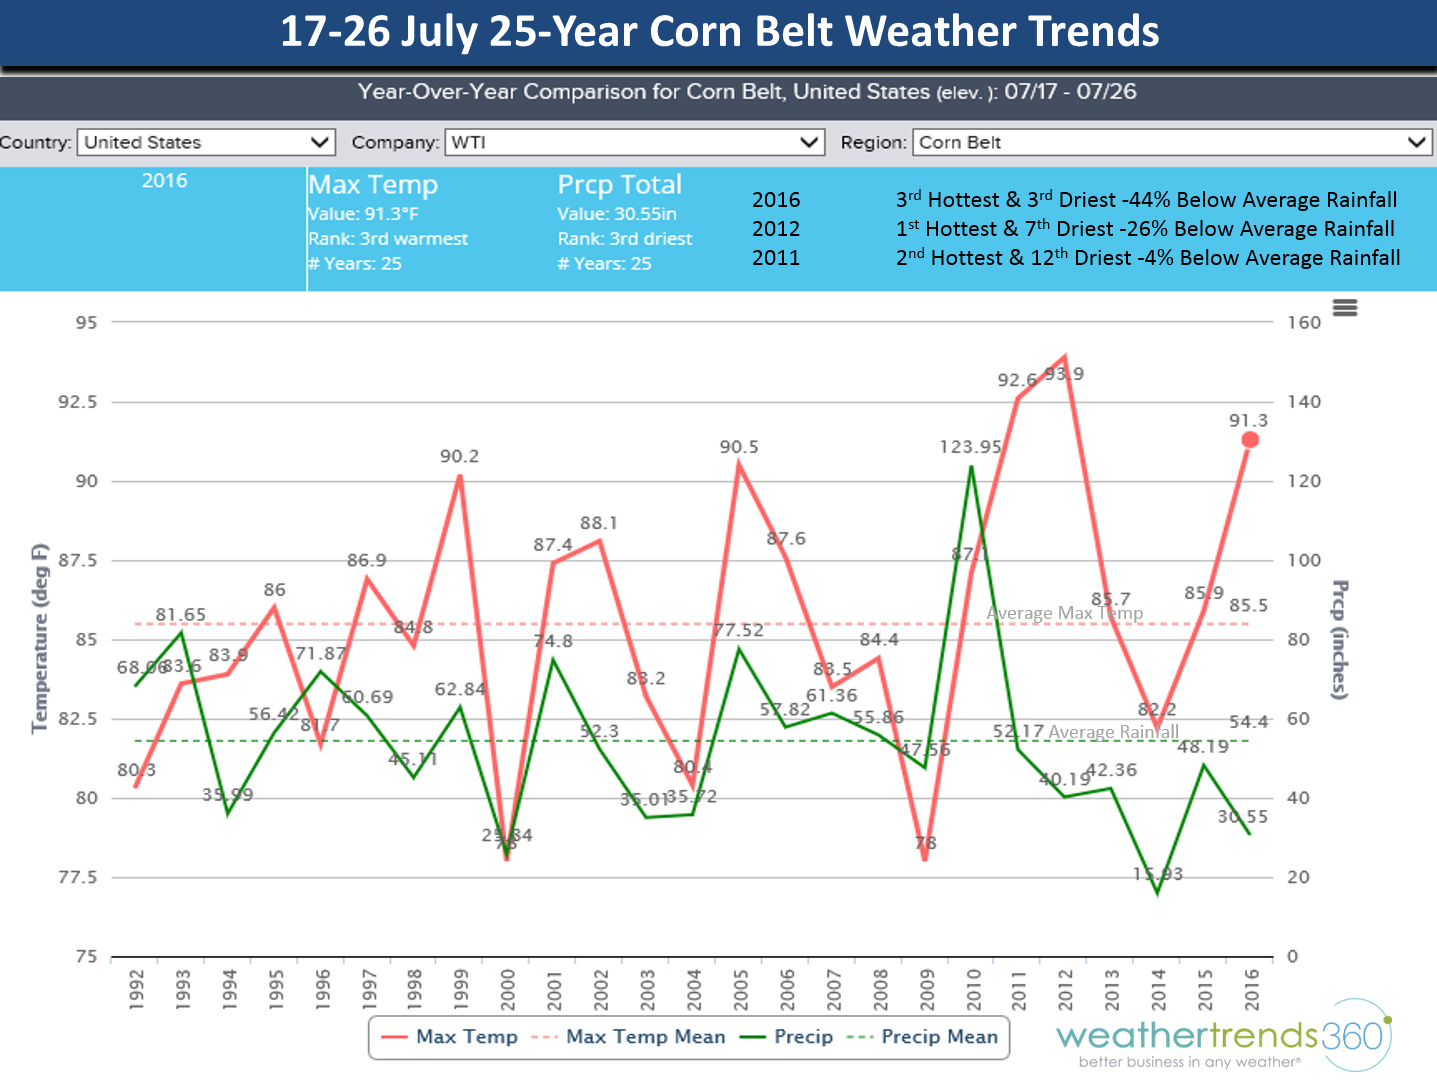
Actually the extreme June temperatures in the Western and Southern Corn Belt in June this year were much worse in 2016 than they were in 2011. The chart below shows the 25 year temperature and rainfall trends for the Corn Belt as a whole. 2016 was very near 2012 in terms of temperatures and much drier than 2011. This has taken the top line yields out of the equation for 2016 as many crops in S-W Iowa, Missouri and S. Illinois rolled for 3-4 weeks during the hot/dry June.

The chart below shows June in 2011 was much cooler and wetter than this year June 2016 across the U.S. Corn Belt, while July 2016will end up hotter/drier than 2011 with the pending heat-wave that is nearly a certainty.

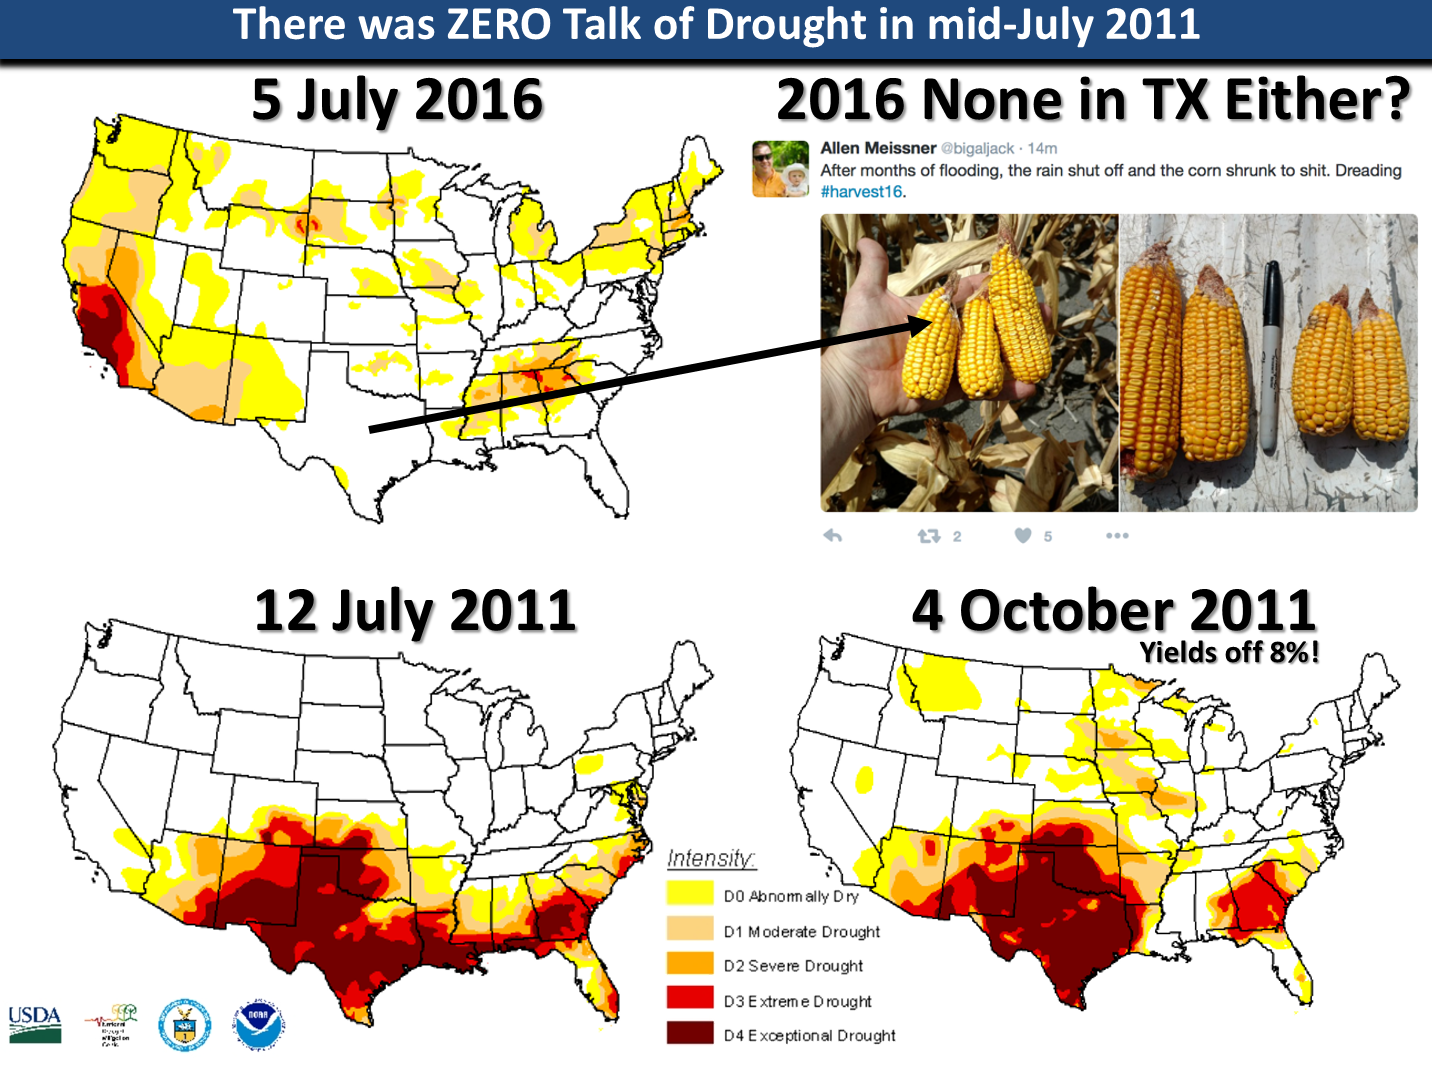
On 12 July 2011 there WAS ZERO TALK ABOUT DROUGHT...NO ONE SAW IT COMING yet yields plummet just a month later. Use the drought monitor at your own risk as it doesn't tell you what's really going on. Redding California is in a moderate drought yet this year is the wettest in 18 years, reservoirs 100% capacity, ground water fully charged but still a moderate drought - not really. Texas has zero drought yet look what a farmer showed for his 2016 yield potential - few weeks of hotter/drier weather, just like Brazil had, game over for rosy yield results. For what it's worth, the drought monitor paints a much less healthy picture on 5 July 2016 when compared to middle July 2011 for the Plains, Great Lakes, Ohio Valley, Northeast.

For the period 1 June - 13 July (meteorological Summer) we had the following Corn Belt weather trends to date:
2011 9th Warmest of the past 25 years, 12th wettest with rainfall -8% below average
2016 4th Warmest of the past 25 years, 10th driest with rainfall -14% below average
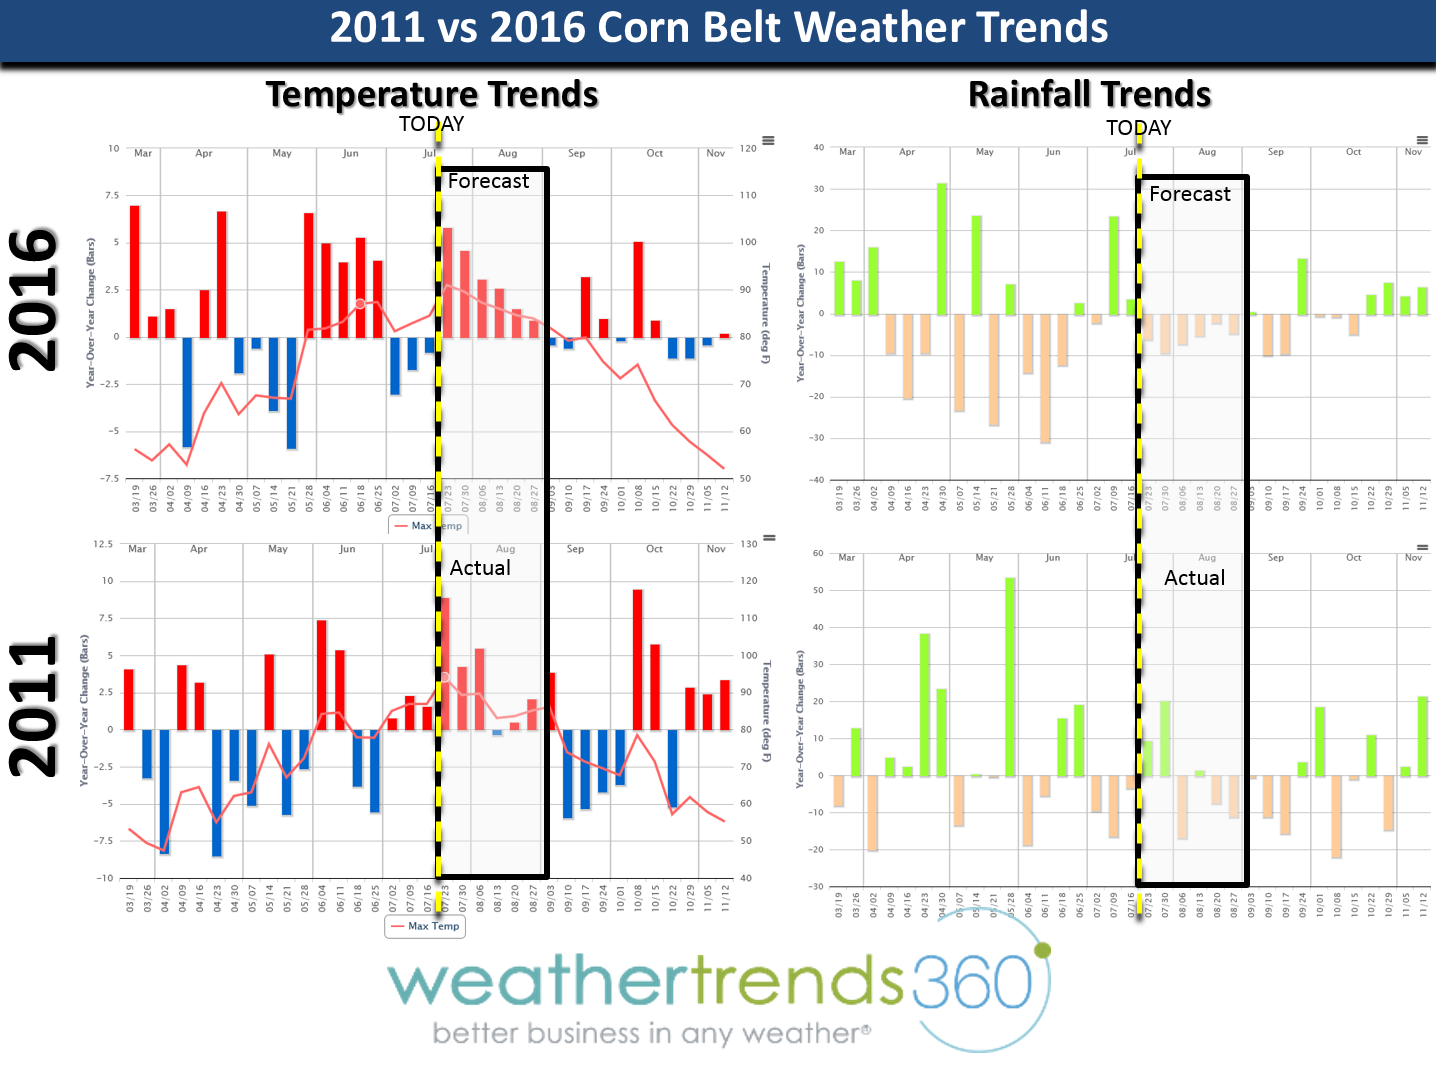
The first major record heat-wave and dry period in 2011 happened the 3rd week of July and continued into the 1st week of August...bad timing in light of pollination/kernel set. Here we go again as that's the outlook for 2016 with model consensus (US GFS, Euro) of a major prolonged heat-wave starting early next week.

Comparing this hot 17-26 July period over the past 25 years we see the following Corn Belt trends:
2016 3rd hottest of the past 25+ years & 3rd driest with rainfall off -44% below average
2011 2nd hottest of the past 25+ years & 12th driest with rainfall -4% below average
2012 1st hottest of the past 25+ years & 7th driest with rainfall -26% below average
So right now this late July period is comparable in terms of temperatures to the disastrous seasons of 2011 and 2012 and even drier than both years for the later half of July! 2014 was actually the driest late July period but also one of the coolest so the stress was much less than a hot/dry pattern.

Comparing this 17-26 July period to 2011 when yields were ultimately trimmed 8% off rosy early season estimates we see a very similar weather outlook for this critical pollination, kernel set period in 2016.
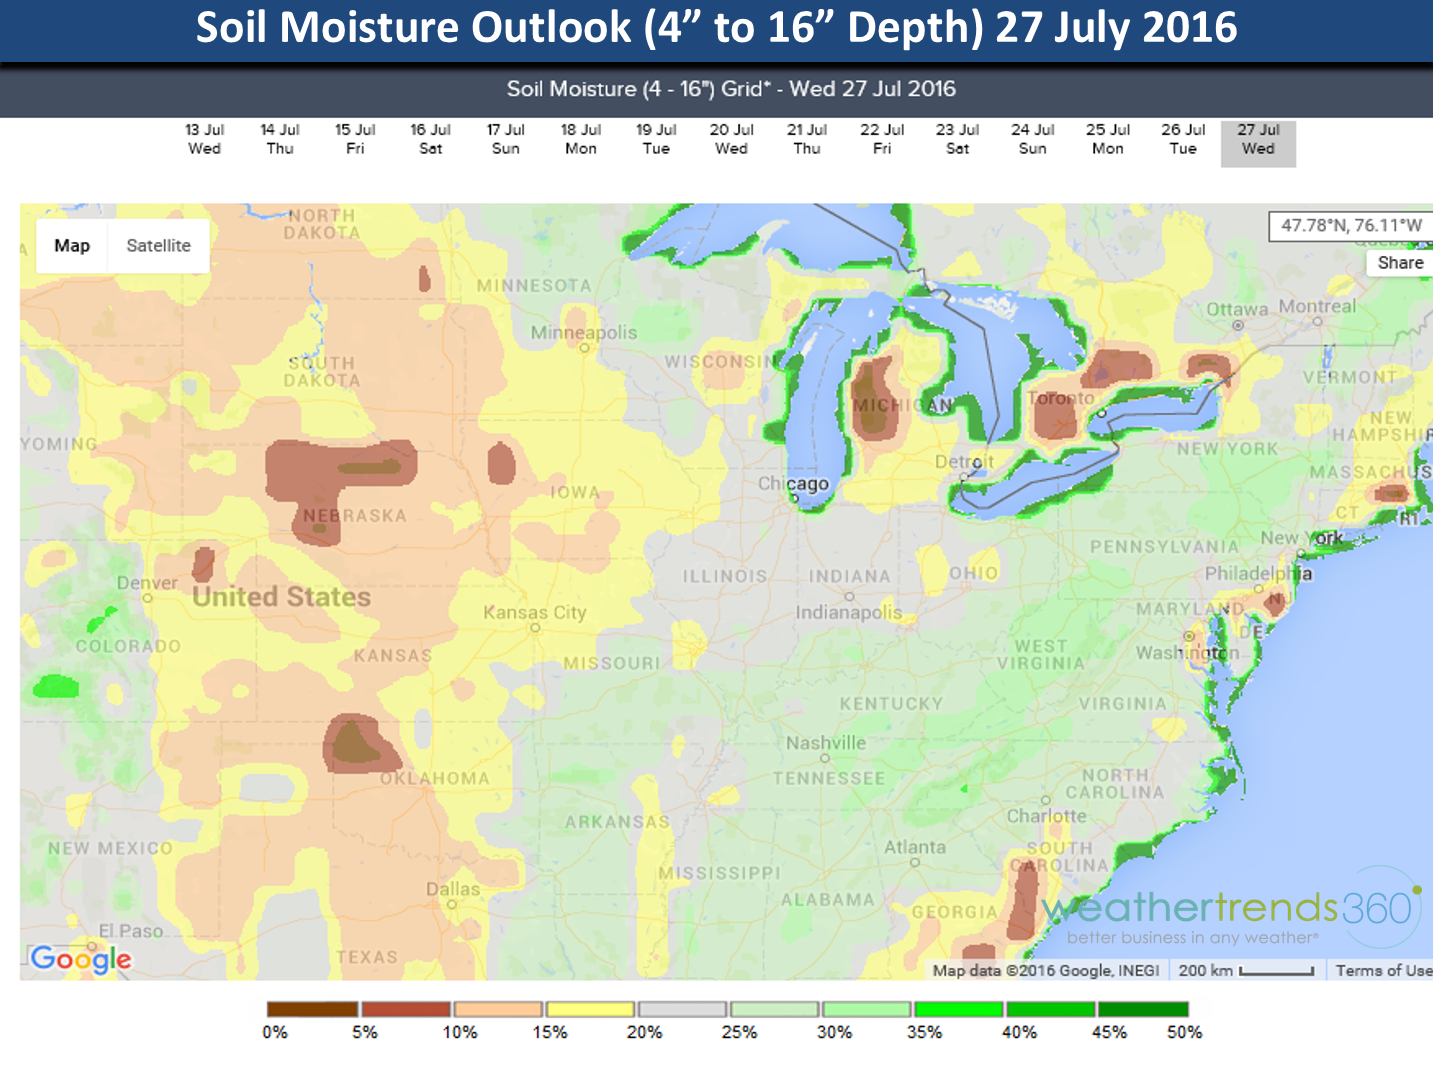
Here's what sub-soil moisture levels are forecast to be by the 27th of July...HOUSTON WE HAVE A PROBLEM.

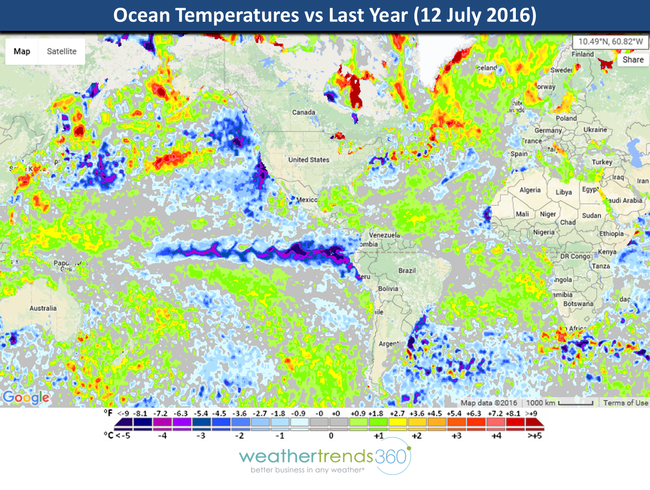
And you don't need -0.5C La Niña to have a hot/dry Summer in the U.S. as the weather trends around the world all scream La Niña-like pattern - wettest in 25+ years in Australia after 2-year El Niño drought, Southeast Asia wettest in 22 years after El Niño drought, Sub-Sahara Africa wettest in decades and the hot/dry conditions for most in North America. Yes some areas are getting heavy rain - not everyone! Comparing the Ocean temperatures around the world compared to this time last year suggests there is NOTHING at all similar weather wise this year vs last year or the past few years.
Ironically Brazil had a soft year in 2011 as well, although not as bad as this disastrous 2016 Safrinha crop. This year they're off 25% so far (it will go lower in light of a late freeze in Parana that had escaped the hot/dry April) for one of the worst seasons in decades as predicted by weather trends last fall.
So let's do the math....if the U.S. is off at least 8% this year, like 2011 (we're projecting at least 8% to 13% off last year), and Brazil off 25%, what price would you expect for Corn? We said $6+ last Fall (Dec '16 futures contract)...still very likely we get somewhere close. But, if you can't stomach the volatility and risk ahead we'd recommend selling when you get back to $4.50, a personal decision for every farmer as every situation is different. The only thing keeping this market from exploding in light of Brazil being off over 551,600,000 bushels from the rosy April government expectations is the equally rosy U.S. market/government expectations that the U.S. crop will save the day with above trend line yields...IT WON'T! There will be a MAJOR CORN RALLY here in late July and August as we said last Fall. Everything that was discussed in our Seeds of Success video series has or is happening to include the prediction of:
We're getting very close to the last and most important prediction! :) THANK GOD! And despite the fact the trade still expects $2-$3.50 corn, despite the fact that U.S. farmers planted 94 million acres, despite the fact there WAS a record global supply (it's plummeting) and despite the fact that hedge funds had to take their corn profits in June to cover metal exposures, etc. etc. etc. we will have a major rally. Warp Speed Ahead.
God Bless the Farmer!
- Captain Kirk out.
Everything was humming along in the U.S. Corn Belt in middle July 2011 up until the 3rd week of July when a major heat-wave and dry spell hit much of the Eastern half of the U.S. and the U.S. Corn Belt. Let's compare 2016 with 2011.
First, let's compare meteorological Summer 1 June - 13 July here in 2016 compared to the same period in 2011. Eerily similar only this Summer has been hotter/drier than 2011 so far, except in Texas.

Actually the extreme June temperatures in the Western and Southern Corn Belt in June this year were much worse in 2016 than they were in 2011. The chart below shows the 25 year temperature and rainfall trends for the Corn Belt as a whole. 2016 was very near 2012 in terms of temperatures and much drier than 2011. This has taken the top line yields out of the equation for 2016 as many crops in S-W Iowa, Missouri and S. Illinois rolled for 3-4 weeks during the hot/dry June.
The chart below shows June in 2011 was much cooler and wetter than this year June 2016 across the U.S. Corn Belt, while July 2016will end up hotter/drier than 2011 with the pending heat-wave that is nearly a certainty.
On 12 July 2011 there WAS ZERO TALK ABOUT DROUGHT...NO ONE SAW IT COMING yet yields plummet just a month later. Use the drought monitor at your own risk as it doesn't tell you what's really going on. Redding California is in a moderate drought yet this year is the wettest in 18 years, reservoirs 100% capacity, ground water fully charged but still a moderate drought - not really. Texas has zero drought yet look what a farmer showed for his 2016 yield potential - few weeks of hotter/drier weather, just like Brazil had, game over for rosy yield results. For what it's worth, the drought monitor paints a much less healthy picture on 5 July 2016 when compared to middle July 2011 for the Plains, Great Lakes, Ohio Valley, Northeast.
For the period 1 June - 13 July (meteorological Summer) we had the following Corn Belt weather trends to date:
2011 9th Warmest of the past 25 years, 12th wettest with rainfall -8% below average
2016 4th Warmest of the past 25 years, 10th driest with rainfall -14% below average
The first major record heat-wave and dry period in 2011 happened the 3rd week of July and continued into the 1st week of August...bad timing in light of pollination/kernel set. Here we go again as that's the outlook for 2016 with model consensus (US GFS, Euro) of a major prolonged heat-wave starting early next week.
Comparing this hot 17-26 July period over the past 25 years we see the following Corn Belt trends:
2016 3rd hottest of the past 25+ years & 3rd driest with rainfall off -44% below average
2011 2nd hottest of the past 25+ years & 12th driest with rainfall -4% below average
2012 1st hottest of the past 25+ years & 7th driest with rainfall -26% below average
So right now this late July period is comparable in terms of temperatures to the disastrous seasons of 2011 and 2012 and even drier than both years for the later half of July! 2014 was actually the driest late July period but also one of the coolest so the stress was much less than a hot/dry pattern.
Comparing this 17-26 July period to 2011 when yields were ultimately trimmed 8% off rosy early season estimates we see a very similar weather outlook for this critical pollination, kernel set period in 2016.
Here's what sub-soil moisture levels are forecast to be by the 27th of July...HOUSTON WE HAVE A PROBLEM.
And you don't need -0.5C La Niña to have a hot/dry Summer in the U.S. as the weather trends around the world all scream La Niña-like pattern - wettest in 25+ years in Australia after 2-year El Niño drought, Southeast Asia wettest in 22 years after El Niño drought, Sub-Sahara Africa wettest in decades and the hot/dry conditions for most in North America. Yes some areas are getting heavy rain - not everyone! Comparing the Ocean temperatures around the world compared to this time last year suggests there is NOTHING at all similar weather wise this year vs last year or the past few years.

Ironically Brazil had a soft year in 2011 as well, although not as bad as this disastrous 2016 Safrinha crop. This year they're off 25% so far (it will go lower in light of a late freeze in Parana that had escaped the hot/dry April) for one of the worst seasons in decades as predicted by weather trends last fall.
So let's do the math....if the U.S. is off at least 8% this year, like 2011 (we're projecting at least 8% to 13% off last year), and Brazil off 25%, what price would you expect for Corn? We said $6+ last Fall (Dec '16 futures contract)...still very likely we get somewhere close. But, if you can't stomach the volatility and risk ahead we'd recommend selling when you get back to $4.50, a personal decision for every farmer as every situation is different. The only thing keeping this market from exploding in light of Brazil being off over 551,600,000 bushels from the rosy April government expectations is the equally rosy U.S. market/government expectations that the U.S. crop will save the day with above trend line yields...IT WON'T! There will be a MAJOR CORN RALLY here in late July and August as we said last Fall. Everything that was discussed in our Seeds of Success video series has or is happening to include the prediction of:
- the record warm U.S. Winter - March, the prediction of "one major snow storm in the Northeast"
- the prediction of the disaster to Brazil's crops
- the flooding for Argentina's crops
- the April and May U.S. frost and freezes (we were off a week - mid May vs early May)
- the wet Spring U.S. planting that farmers in the Western Corn Belt are going to suffer with now in light of shallow packed roots
- the La Niña-like drought-ending weather for Australia, Southeast Asia, Africa
- the fastest start to the hurricane season in 165 years (4 named storms by middle June)
- the pattern shift in June with the forecast of the hottest/driest Summer in 4 years (June - August)
- and lastly the prediction of a major corn rally in late July and August.
We're getting very close to the last and most important prediction! :) THANK GOD! And despite the fact the trade still expects $2-$3.50 corn, despite the fact that U.S. farmers planted 94 million acres, despite the fact there WAS a record global supply (it's plummeting) and despite the fact that hedge funds had to take their corn profits in June to cover metal exposures, etc. etc. etc. we will have a major rally. Warp Speed Ahead.
God Bless the Farmer!
- Captain Kirk out.